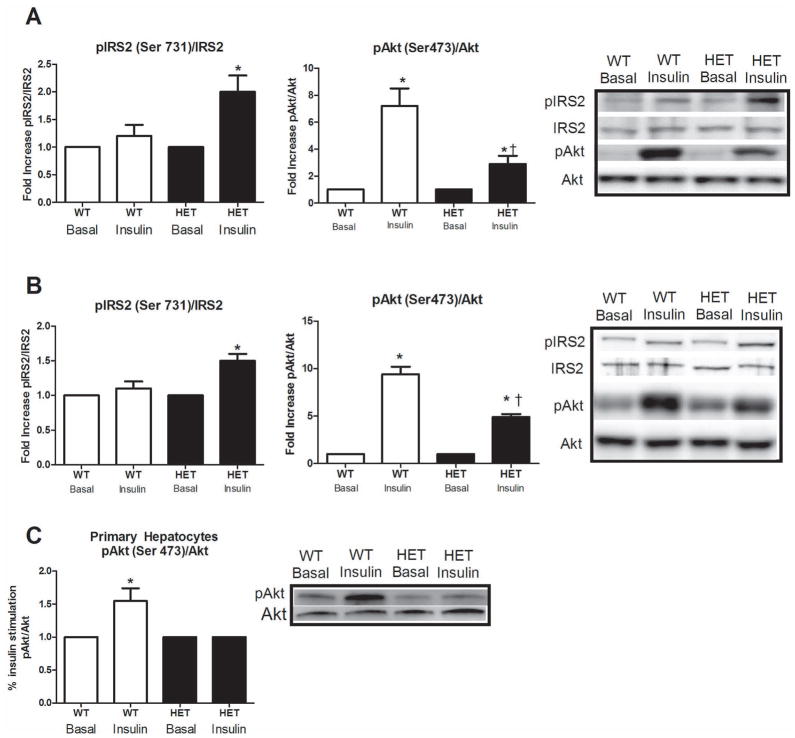
Figure 3.
Hepatic insulin signaling at the level of IRS-2 and Akt in HET MTP and WT mice. IRS-2 and Akt phosphorylation status in the liver under hyperinsulinemic-euglycemic clamp (Figure 3A) and acute insulin stimulated (Figure 3B) conditions and Akt phosphorylation status in isolated primary hepatocytes exposed to acute insulin stimulation (Figure 3C). * Significant difference between basal and insulin stimulation, p<0.05. † Significantly different than WT under same condition, p<0.05.

