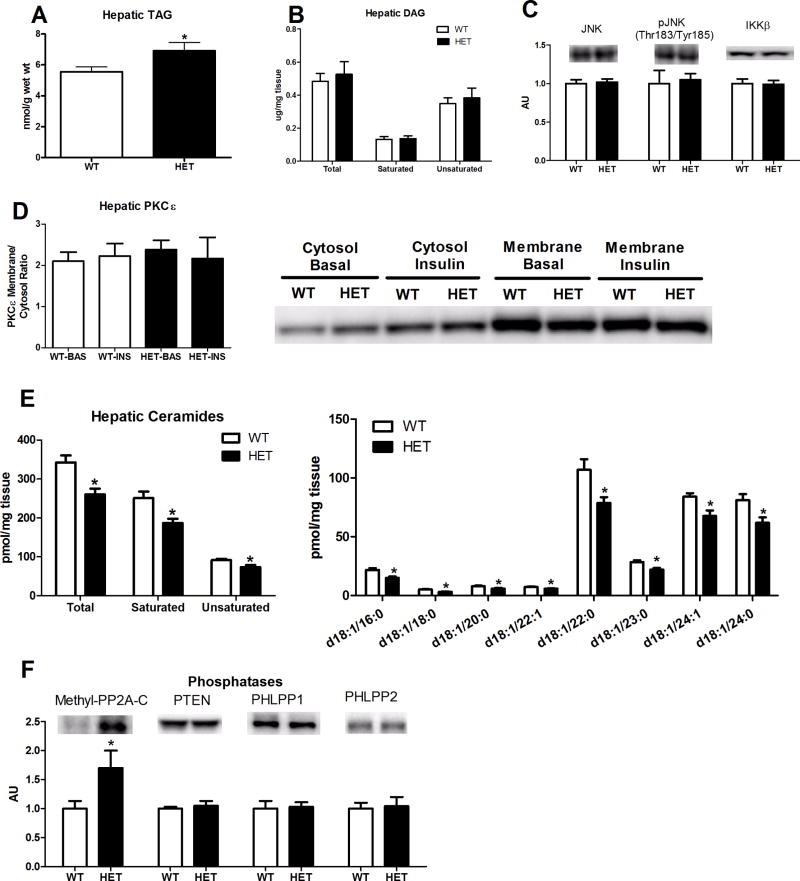
Figure 5.
Hepatic TAGs, DAGs, JNK activation, PKCε activation status, ceramide species, and protein content of protein phosphatases in HET MTP and WT mice. Hepatic TAG content (Figure 5A); total, saturated, and unsaturated hepatic DAG content (Figure 5B); hepatic JNK, phospho-JNK, and IKKβ protein content (Figure 5C), basal and insulin-stimulated PKCε protein content either in the cytosol or in the membrane fraction (Figure 5D), total ceramide content (saturated and unsaturated) and individual ceramide molecular species (Figure 5E), and hepatic protein content of protein phosphatases (Figure 5F). Values are means ± SE (n=8–12 per group; 9–10 per group for ceramide analyses). * Significantly different than WT under same condition, p<0.05.

