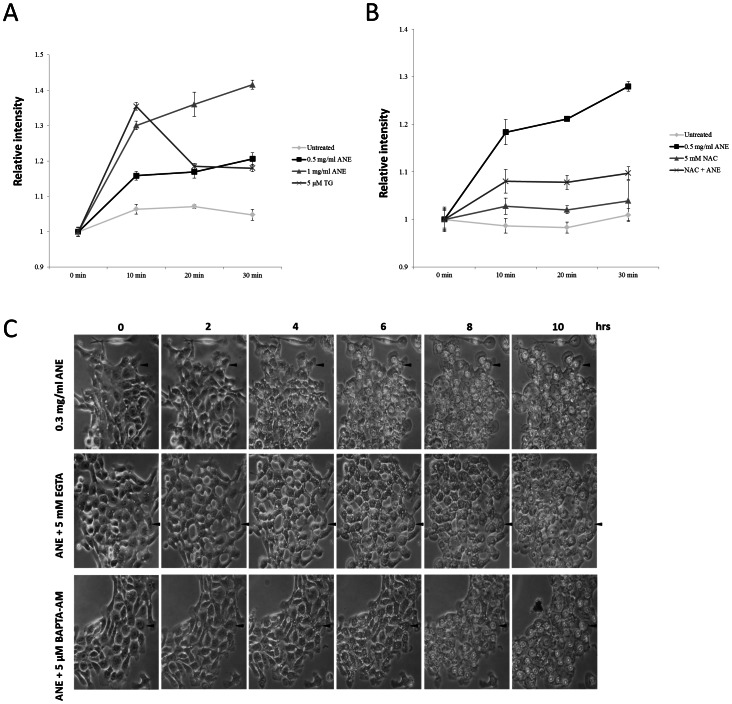
Figure 4. Calcium signaling was involved in ANE-induced pyknotic necrosis.
(A) Calcium flux in SAS cells treated with the indicated doses of ANE was measured as described in experimental procedures. (B) Similar to the condition in (A), calcium flux was evaluated in the presence or absence of NAC. (C) Cells co-treated with ANE and either 5 mM EGTA or 5 µM BAPTA-AM were photographed at the indicated time points.

