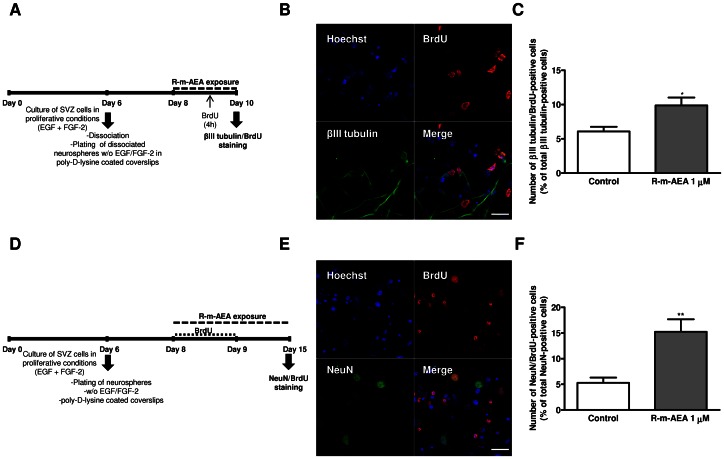
Figure 6. (R)-(+)-Methanandamide promotes proliferation of neuroblasts.
A, D: Experimental protocol. B, E: Representative confocal digital images of BrdU (red), βIII tubulin (green) and Hoechst staining (blue) (B) and of BrdU (red), NeuN (green) and Hoechst staining (blue) (E). Scale bar = 20 µm. C, F: Bar graphs depict the number of βIII tubulin/BrdU-positive cells expressed as percentage of total βIII tubulin positive cells (C) and NeuN/BrdU-positive cells expressed as percentage of total NeuN-positive cells (F) per culture. Data are expressed as mean ± SEM. N = 3. *P<0.05, **P<0.01 using unpaired Student’s t test for comparison with control. βIII tubulin: Neuron-specific class III beta-tubulin; NeuN: Neuronal Nuclei.

