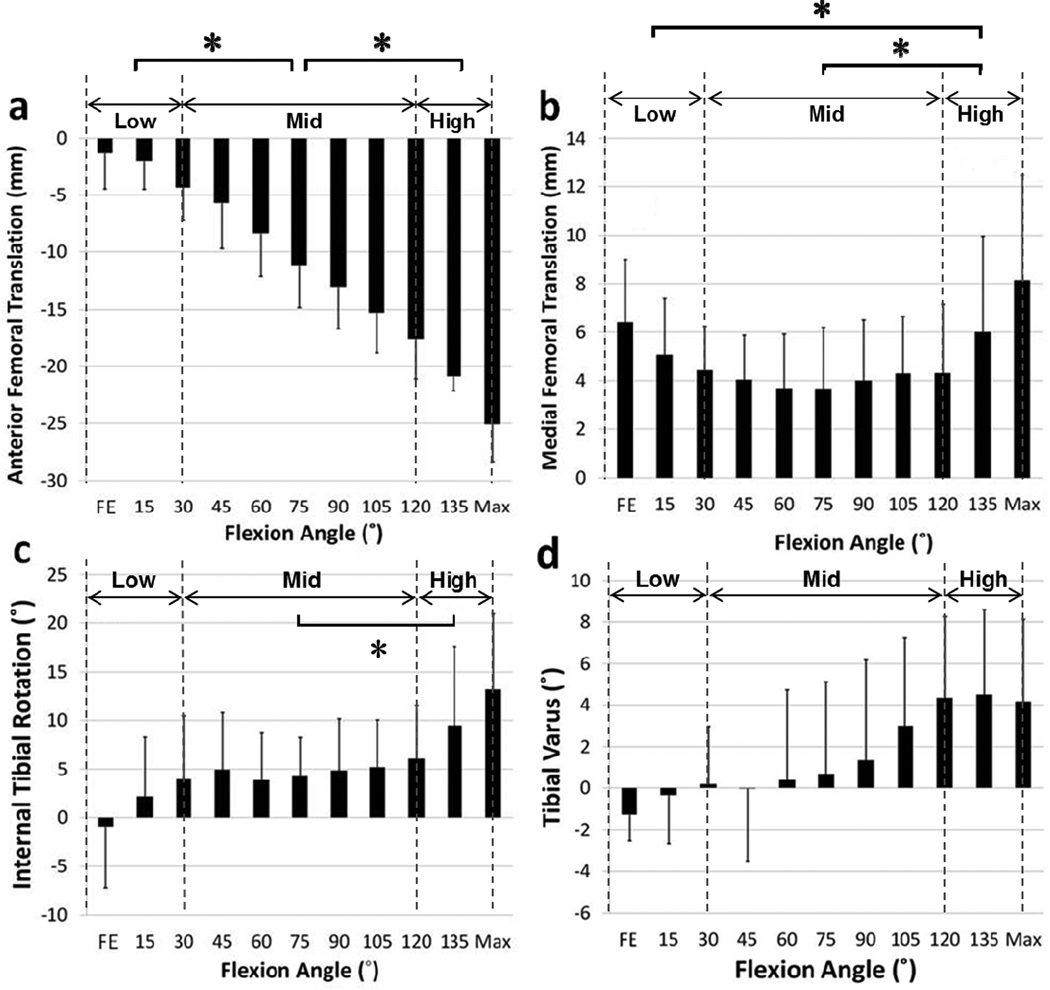
Figure 3.
(a) Anterior and (b) medial translations; (c) internal and (d) varus rotations of the tibia relative to femur during the full range of knee flexion (FE: Full extension; Max: Maximal flexion). Asterisk means a statistically significant difference in mean values between 120° and maximal flexion. The data are presented in mean values and their corresponding standard deviations.
Low: low flexion range (full extension to 30° of flexion);
Mid: middle flexion range (30° to 120° of flexion);
High: high flexion range (120° to maximal flexion)

