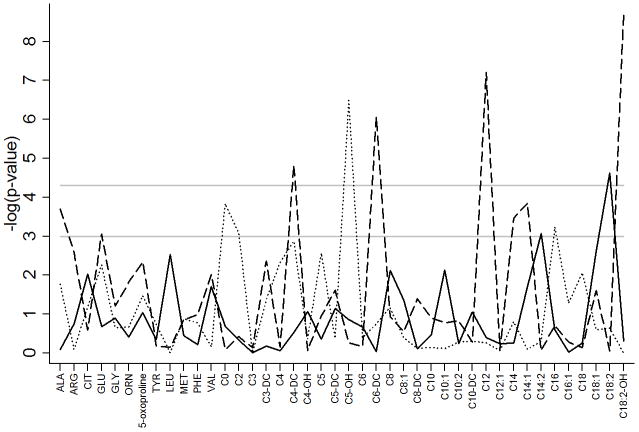
Figure 1.
Metabolite associations with infant demographics. Associations are represented by the negative logarithm of the p-value with the solid line representing age at time of sample collection, the dashed line representing season of birth and the dotted line representing twin or multiple gestations. The first horizontal gray solid line at −log(p)=3 represents a p-value of ≤0.001, the second horizontal gray solid line at −log(p)=4.3 represents Bonferroni corrected significance threshold of p≤5×10⁻⁵.

