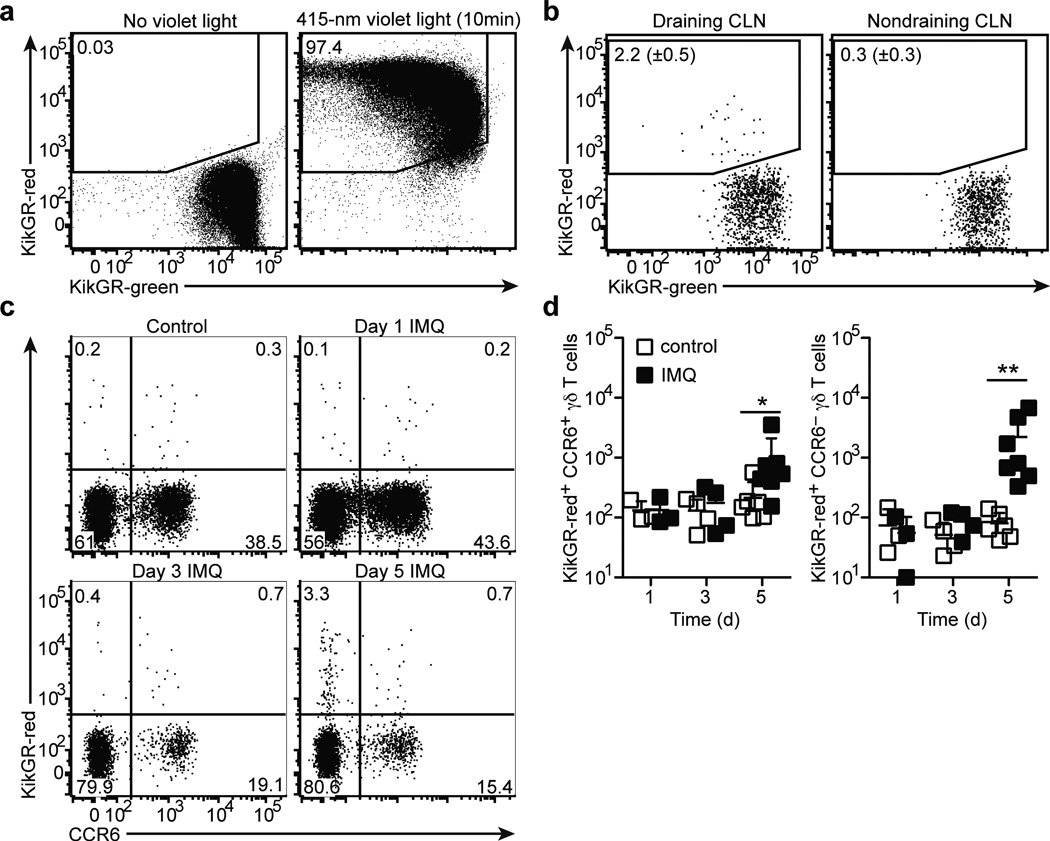
Figure 7. γδT17 cells migrate from skin to draining lymph nodes at low rates.
(a) Flow cytometric detection of KikGR-red+ and KikGR-green+ cells in ear skin cell suspensions harvested immediately after exposure to violet light (right) or untreated (left), gated on total live cells. (b) Flow cytometric detection of KikGR-red+ CCR6+ γδ T cells in draining (left) and non-draining (right) cervical LNs (CLN) harvested 24 hours after ear skin photoconversion, gated on total CCR6+ γδ T cells. The mean (± s.d.) %KikGR-red+ cells from four independent experiments are indicated (n=4 mice). (c) Flow cytometric detection of KikGR-red+ CCR6+ and CCR6− γδT cells in draining CLNs of control and imiquimod-treated ear skin harvested at the indicated day of imiquimod treatment and one day after photoconversion, gated on total γδ T cells. (d) Quantification of KikGR-red+ CCR6+ and CCR6− γδ T cells in draining CLNs of control (empty squares) and imiquimod-treated (filled squares) ear skin, treated as in (c). Each symbol represents an individual CLN; horizontal bars represent the mean (± s.d.). *P≤0.05, **P≤0.001. Data are representative three experiments with 3 mice (a), four experiments with 4 mice (b), and 6 experiments with 3–7 mice at each time point (c,d).

