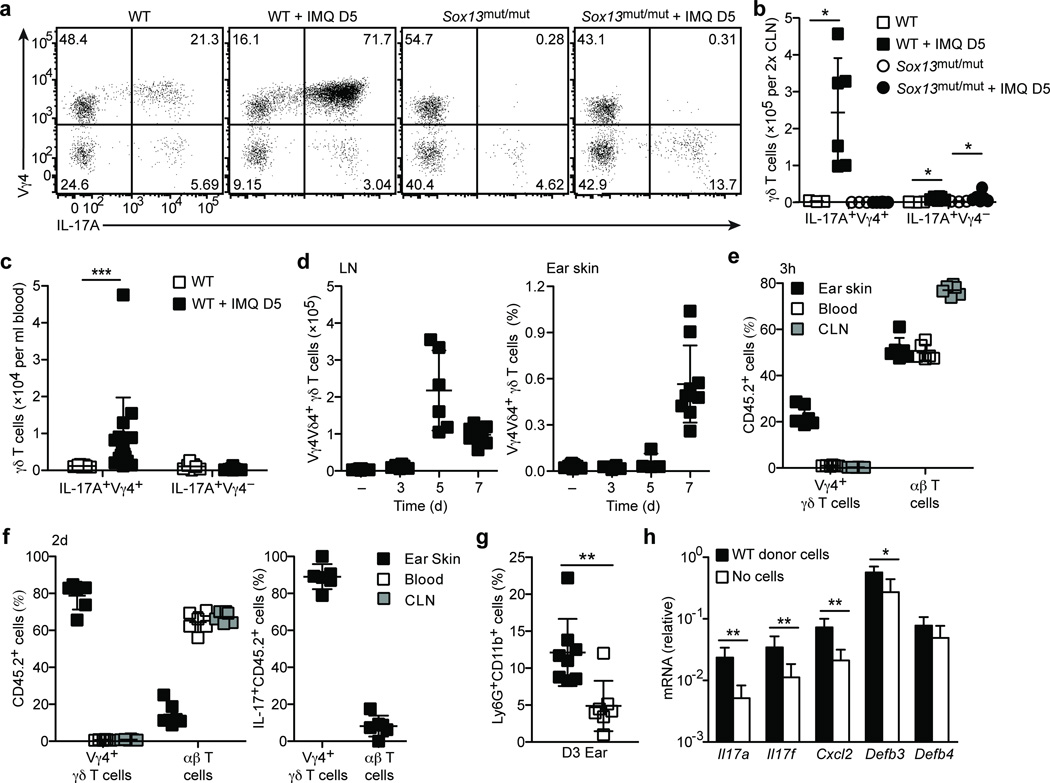
Figure 8. Vγ4+ γδT17 cells expand in draining LNs and home to inflamed ear skin.
(a) Intracellular IL-17A staining of PMA+I stimulated CLN cell suspensions from WT (B6/NCI) and Sox13mut/mut (B6.SJL/NCI) mice treated with imiquimod or control cream for 5 days, gated on total γδ T cells. (b,c) Quantification of IL-17A+ γδ T cells in CLNs (b) and blood (c) from mice treated as in (a). (d) Quantification Vγ4+Vδ4+ γδ T cell number in CLNs (left panel) or frequency in ear skin (right panel, plotted as % of live cells) treated as in (a) for 3–7 days. (e) Quantification of donor T cells in the indicated tissues, plotted as percent of CD45.2+ donor cells, from day 2 imiquimod-treated Sox13mut/mut recipients 3 hours after transfer of CLN cells from day 5 or 7 imiquimod-treated WT mice. (f) Quantification of donor T cells in the indicated tissues, plotted as percent of CD45.2+ (left panel) and IL-17A+CD45.2+ (right panel) donor cells from day 3 imiquimod-treated Sox13mut/mut recipients 2 days after transfer of CLN cells from day 5 imiquimod-treated WT mice. (g,h) Quantification of Ly6G+CD11b+ neutrophils, plotted as percent of CD45+ cells (g), and mRNA by RT-PCR (h) in ear skin from mice treated as in (f). Each symbol represents an individual mouse; horizontal bars represent the mean (± s.d.). *P≤0.05, **P≤0.01, ***P≤0.001. Data are representative of at least three experiments (a–e,g) or two experiments with at least 5 mice (f,h).

