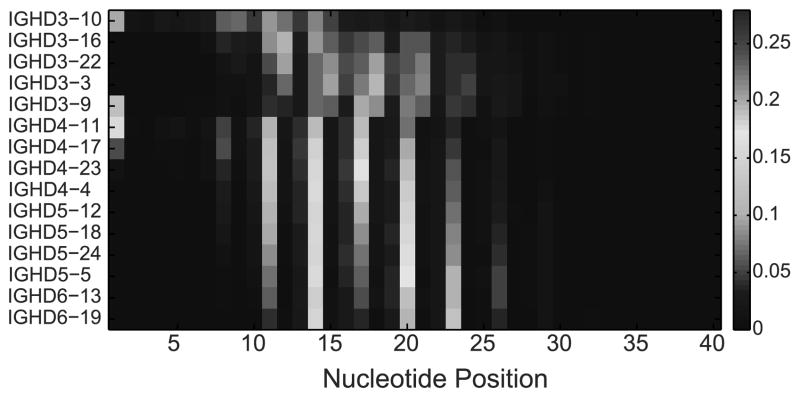
Figure 5. Frequency of position of end of DH for each DH gene.
Each column is a position at the end of DH starting from 10 positions into VH. Each row is a DH gene. The colors represent frequency, as showed in the colorbar. One can clearly see in most DH genes jumps of three in the position, but beyond the clear selection for a DRF, the position distribution is quite wide.

