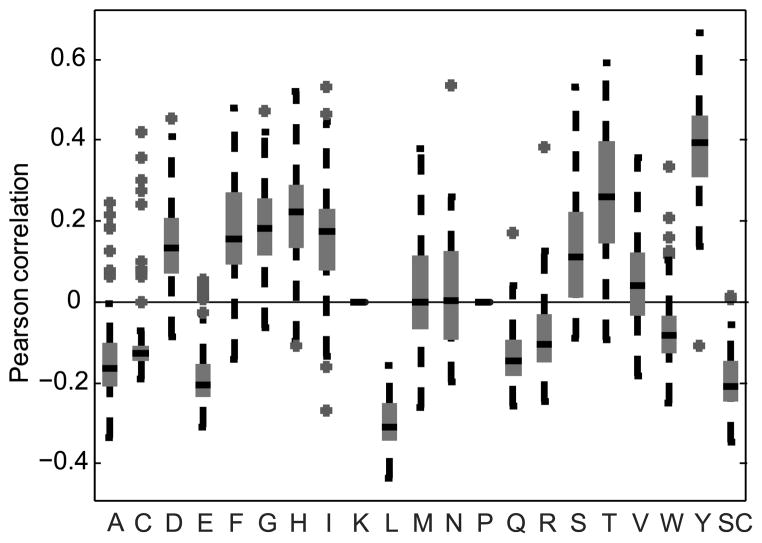
Figure 9. Pearson correlation of DRF usage with the number of times each amino acid appears in each reading frame.
The X-axis represents amino acids. The values on the Y-axis are the Pearson correlation coefficients of the DRF usage and the amino acid frequency vectors. Only correlations with a p-value of 0.05 or lower were used. Lysine and Proline are practically never used in DH genes so they are not incorporated in the analysis. Each box contains all the samples (8 samples were analyzed for each one of the 12 subjects: IgA, IgG, IgM naïve, IgM memory, each performed in duplicate). As one can clearly see, some of the amino acids are practically always positively correlated with the DRF usage, and some practically always negatively correlated. Note that the correlation is biased by the presence of stop codons. For example, Leucine is often present near stop codons. We present in Supplemental Fig. 4 a similar analysis when only sequences with no SCs are used.

