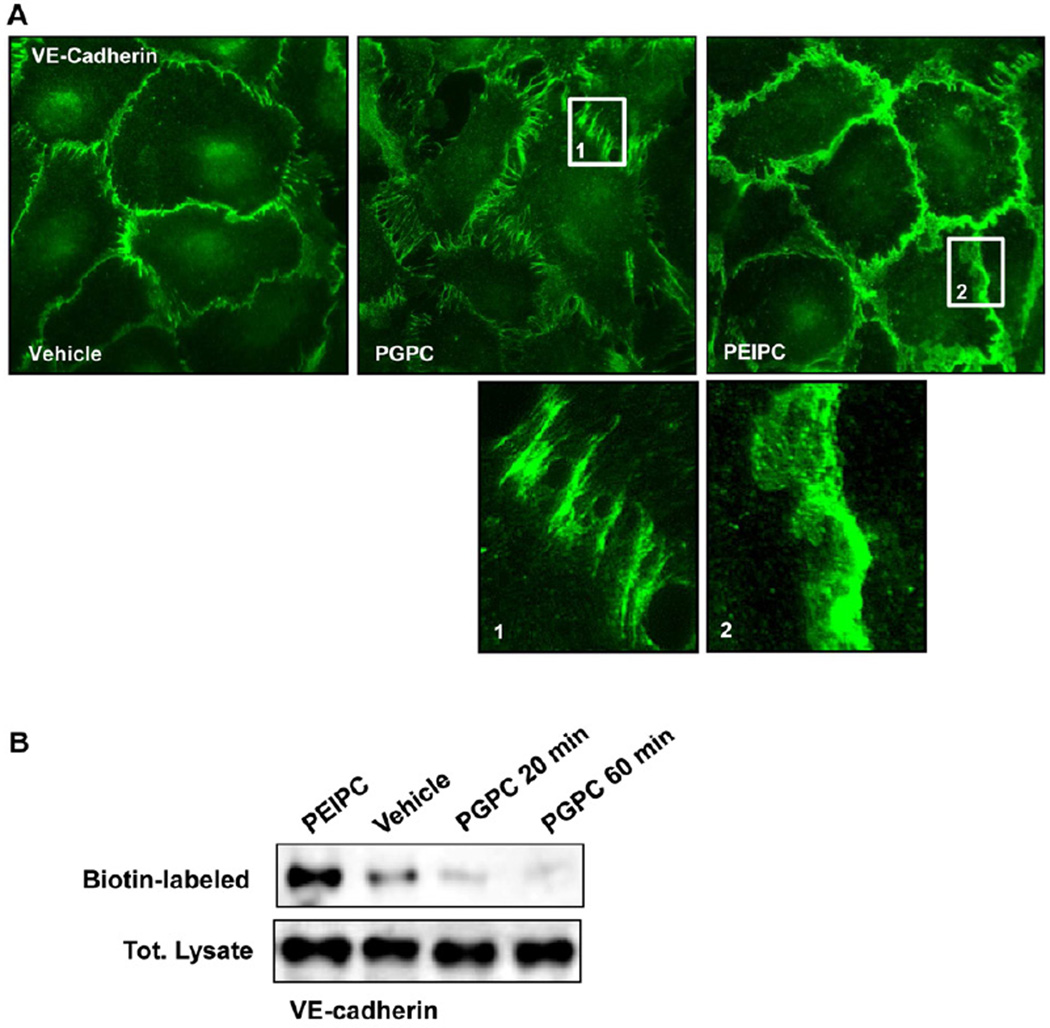
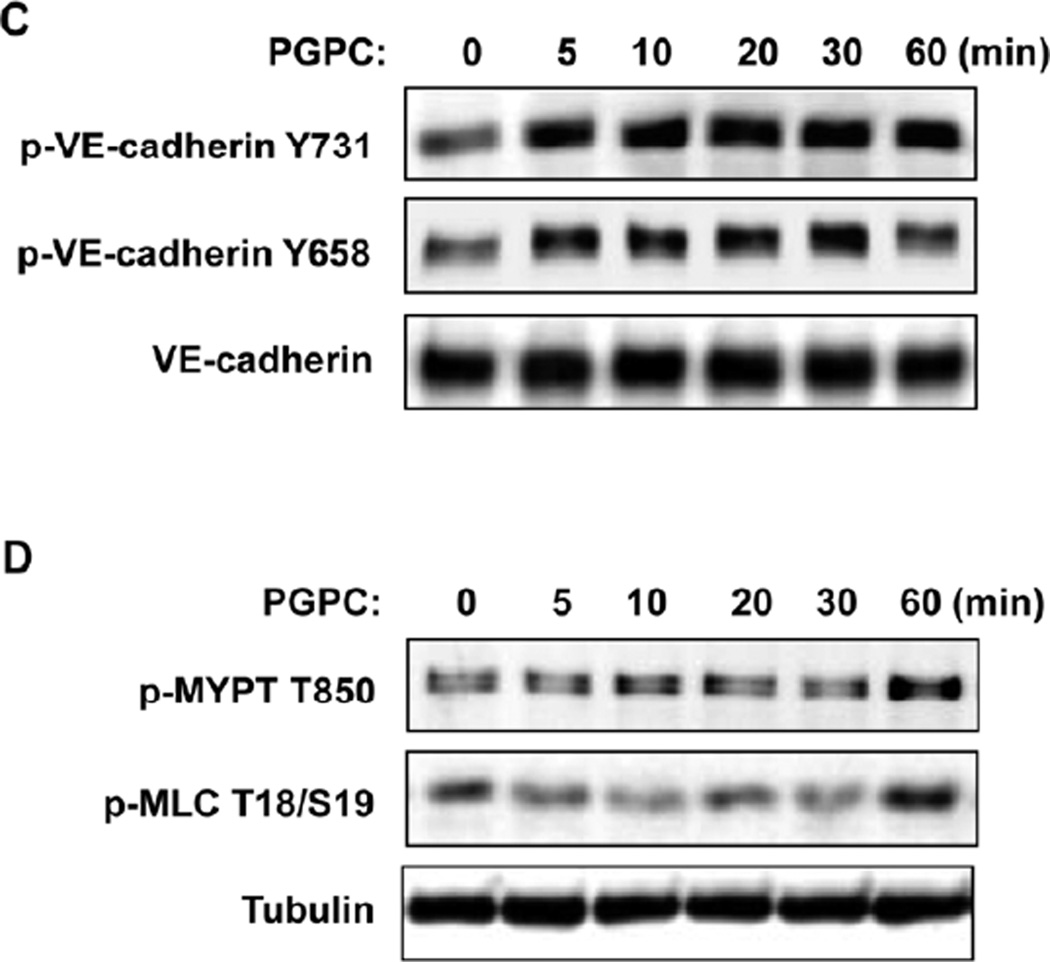
Figure 4. Effects of PGPC and PEIPC on intracellular distribution and phosphorylation of VE-cadherin and downstream Rho targets.
A – Endothelial monolayers grown on glass coverslips were stimulated with PGPC (30 µg/ml, 30 min) or PEIPC (2 µg/ml, 30 min) followed by immunofluorescence staining for VE-cadherin. Insets depict higher magnification areas of VE-cadherin immunoreactivity at cell-cell junctions of PGPC and PEIPC treated endothelial monolayers. Shown are representative results of three independent experiments. B - HPAECs were stimulated with PEIPC or PGPC for indicated periods of time, washed, and cell surface proteins were labeled with Sulfo-NHS-SS-Biotin as described in Methods. Cells were lysed, and biotinylated proteins precipitated with streptavidin-agarose. Presence of biotinylated VE-cadherin was evaluated by Western blot analysis. C - EC were stimulated with PGPC (30 µg/ml) for indicated periods of time, and VE-cadherin phosphorylation at Tyr731 and Tyr658 was examined by western blot. Staining with VE-cadherin antibody was used as normalization control. D - Time course of myosin light chain phosphatase (MYPT) and myosin light chain (MLC) phosphorylation induced by PGPC was examined by western blot with corresponding phospho-specific antibodies. µ-Tubulin antibody was used as normalization control.


