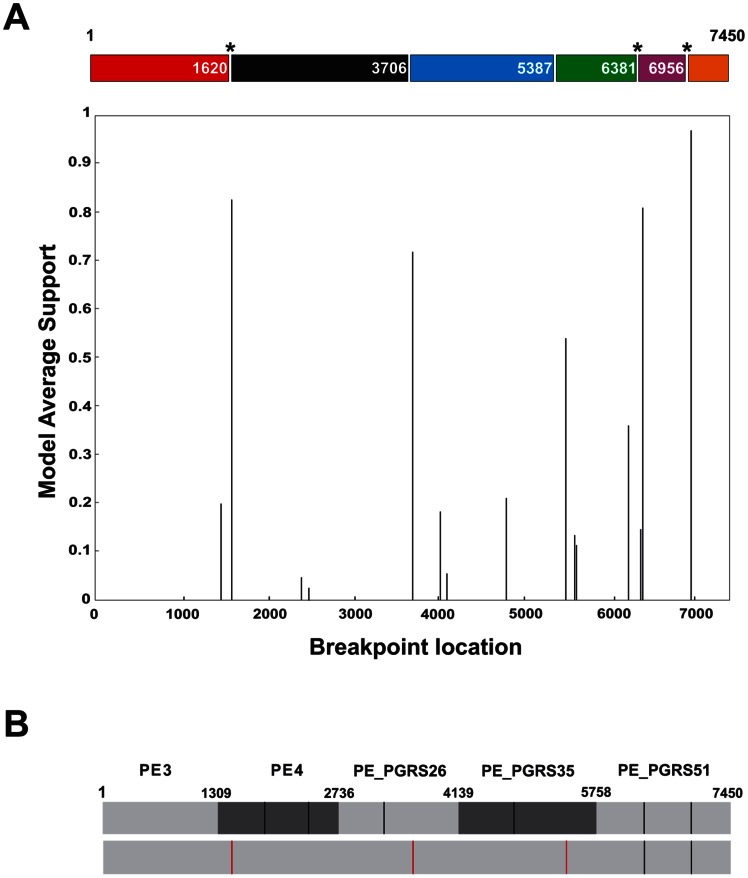
Figure 4. Detection of recombination breakpoints with GARD upon concatenation of PE/PE_PGRS sequences.
(A) GARD plot showing potential recombination breakpoints within the concatenated PE/PE_PGRS sequence (PE3-PE4-PE_PGRS26-PE_PGRS35-PE_PGRS51). (B) Position of potential recombination breakpoints (black vertical bars) identified on a gene-by-gene analysis (top) and within the concatenated sequence (red vertical bars) (bottom). The probability of the breakpoints is evaluated by akaike information criterion (AIC) score and Kishino-Hasegawa topological incongruence test [73]. Model supported breakpoints are indicated with an asterisk.

