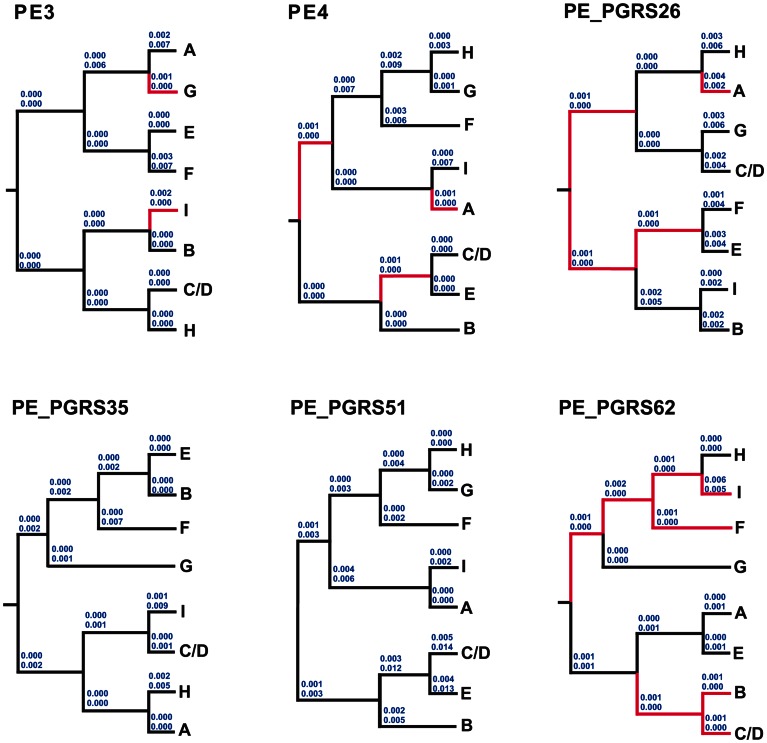
Figure 5. Estimation of dN/dS ratios along branches of STB PE/PE_PGRS individual trees using the covarion-based approach described by Siltberg and Liberles [80].
dN and dS rates (top and bottom numbers, respectively) are shown on branches. Branches where positive selection was detected are drawn in red.

