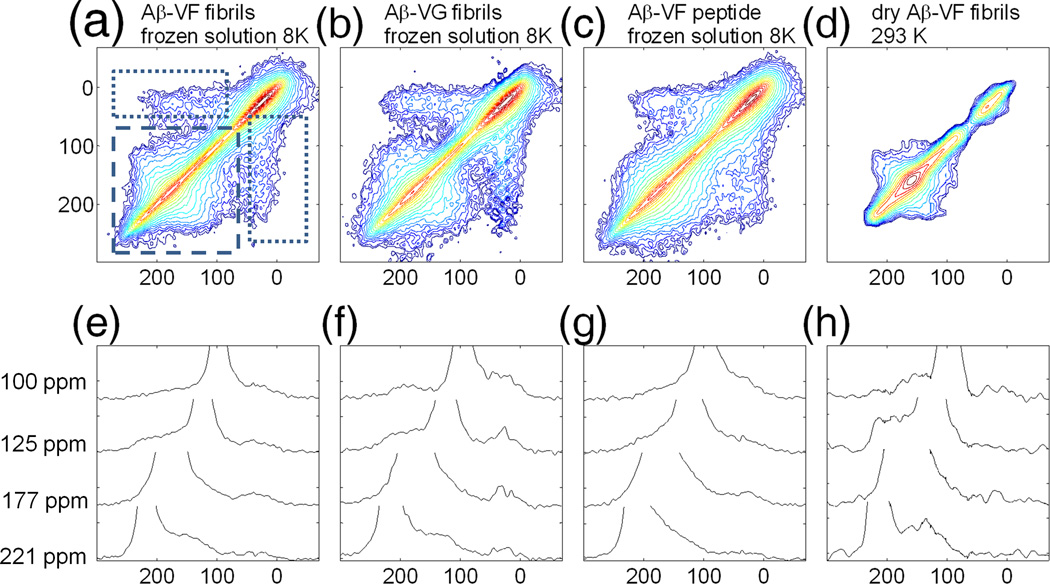
Fig. 3.
2D 13C-13C exchange spectra obtained for various samples, exchange time in all experiments τexchange=2.5 s, the lowest contour in 2D plots is drawn at 6σ – standard deviation of noise in experimental spectrum. Each next level height is incremented by a factor of 1.3. a) Aβ-VF fibrils in frozen solution at 8 K, spectrum accumulation time ~4 hr with DNP enhancement. Dashed rectangle encloses the area of carbonyl-carbonyl correlation; dotted rectangle encloses the area of carbonyl-methyl carbon correlation; b) Aβ-VG fibrils in frozen solution at 8 K, spectrum accumulation time ~4 hr with DNP enhancement; c) Aβ-VF peptide in frozen solution at 8 K, spectrum accumulation time ~6 hr with DNP enhancement; d) dry Aβ-VF fibrils at room temperature, spectrum accumulation time ~ 4 days. ; e),f),g),h) represent slices made at specified values of chemical shifts in 2D plots a),b),c),d) respectively.

