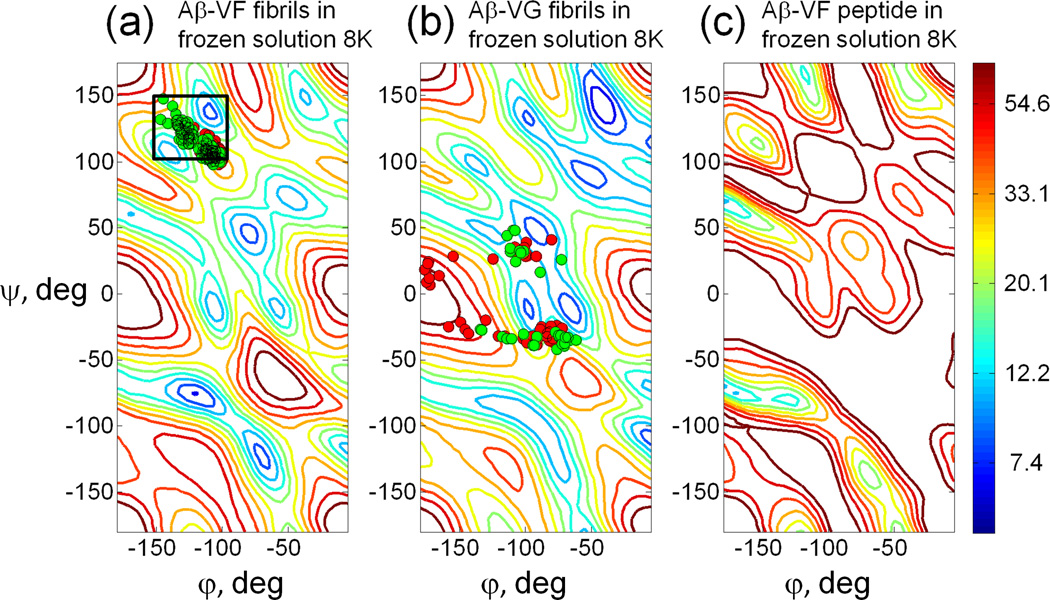
Fig. 7.
plots for three cases a) Aβ-VF fibrils in frozen solution at 8 K obtained by fitting exchange spectra with various τexchange altogether; b) Aβ-VG fibrils in frozen solution at 8 K obtained by fitting exchange spectra with τexchange = 2.5 s ; c) Aβ-VF peptide in frozen solution at 8 K obtained by fitting exchange spectra with τexchange = 2.5 s. Scattered markers in plot (a) and (b) denote (ϕ,ψ) angles obtained from various structural models for F19 and G25 respectively: red-three-fold symmetric positive stagger 2LMP, green – three-fold symmetric negative stagger 2LMQ. Black rectangle in plot (a) marks the range of (ϕ,ψ) angles for Phe19 in Aβ-fibrils as predicted by TALOS+ program.

