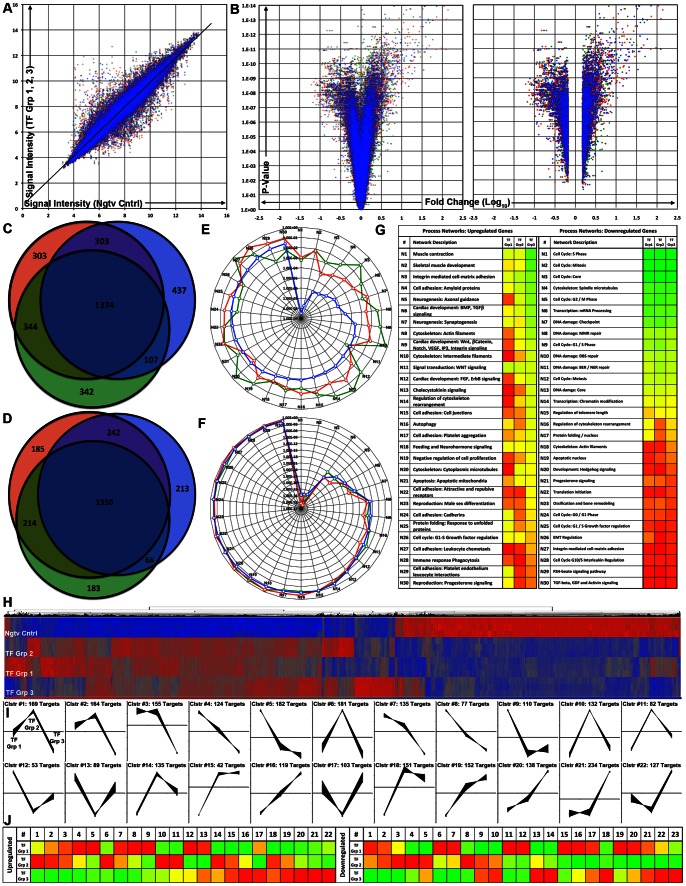
Figure 4. Microarray gene expression analysis performed on populations of reprogrammed MEFs.
A. Plot of signal intensity ratios for each individual chip probe when comparing MEFs transduced with any of the three combinations of TF modules to the negative control (TF Group 1 G4T5MC (Green), TF Group 2 G4T5MCM1S3 (Red), TF Group 3 G4T5MCMDSFM1S3 (Blue)). B. Volcano plots displaying the relationship between the calculated fold change for each individual chip probe (when comparing each of the treated cell groups and the negative control) versus the P-value determined using ANOVA statistical analysis. The graph on the left contains all the chip probes whereas the graph on the right contains only probes that are significantly upregulated or downregulated (Fold Change<or >1.5, p-value <0.05) (TF Group 1 (Green), TF Group 2 (Red), TF Group 3 (Blue)). C–D. Venn diagrams displaying the numbers of common probe IDs for either significantly upregulated (C) or significantly downregulated chip probes (D) when comparing each of the treated cell groups and the negative control. The 1374 chip probes common for significantly upregulated genes correspond to 1065 genes whereas the 1350 chip probes common for the significantly downregulated genes correspond to 980 genes (TF Group 1 (Green), TF Group 2 (Red), TF Group 3 (Blue)). E–G. Gene process networks that are either activated (E, upregulated genes) or deactivated (F, downregulated genes) in MEFs transduced with the three TF module combinations as compared to negative control, were determined using the Thomson Reuters GeneGo MetaCore™ data meta-analysis tool (TF Group 1 (Green), TF Group 2 (Red), TF Group 3 (Blue)). Based on the list of significantly upregulated or downregulated genes each process network received a p-value indicating the statistical probability that the network is affected in the population of reprogrammed cells. The range of calculated p-values for each process network is graphically represented with a green to red color range (G). Activated networks: Lowest p-value: 3.16×10⁻⁹ (Green) and highest p-value: 6.53×10⁻¹ (Red). Deactivated networks: Lowest p-value: 2.40×10−40 and highest p-value: 7.06×10⁻¹ (Red). H. Graphical representation of hierarchical clustering analysis performed on the union of all of the significantly upregulated (Red, +2.69) or significantly downregulated genes (Blue, −2.69). I–J. Graphical representation of self-organizing map clustering analysis performed on the union of all of the significantly upregulated or significantly downregulated genes. We detected 22 unique self-organized gene groups for the upregulated genes (I) and 23 unique self-organized gene groups for the downregulated genes. Graphical representation of a normalized average gene expression pattern for each of the unique groups identified by self-organizing map clustering analysis for the three combinations of transcriptional modules (J) (Range: −1.5/Green to 1.5/Red).

