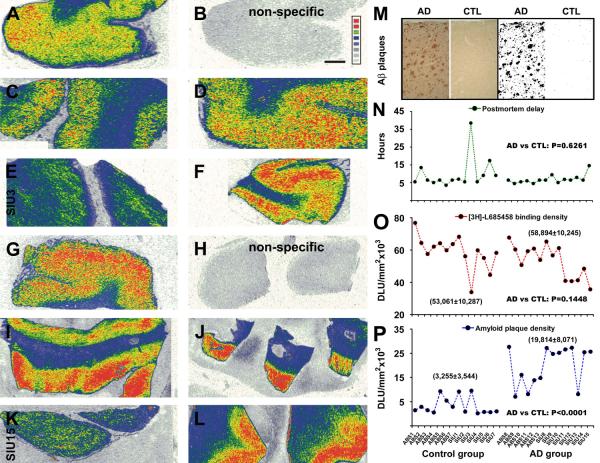
Fig. 2.
Correlative analysis of [3H]-L-685,458 binding sites and amyloid plaques in the temporal neocortex from control and AD subjects. Autoradiographs show cortical γ-secretase binding sites in 5 control (A-F) and 5 AD (G-L) cases. Levels of non-specific binding are shown in (B) and (H). Amyloid plaques are quantified using a threshold selection approach (M). Panel (N) depicts the distribution of postmortem delay among studied cases, with no difference in the means of the control and AD groups. Panel (O) shows the distribution of [3H]-L-685,458 binding sites (averaged from 4 sections) among individual cases, with no difference in the mean specific density between the two groups (58,894±10,245 DLU/mm2 in AD vs 53,061±10,287 DLU/mm2 in control). Panel (P) plots the distribution of average amyloid plaque densities among individual cases. The mean density is dramatically higher in the AD (19,814±8,071 DLU/mm2) than the control (3,255±3,544 DLU/mm2) group. DLU: digital light unit. Scale bar = 500 :m in (B) applying to all image panels.

