
FIGURE 6.
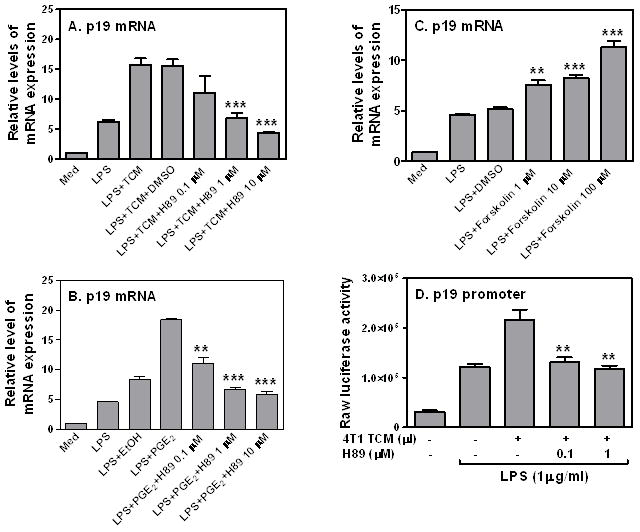
The effect of 4T1 TCM on LPS-induced p19 expression is mediated through the cAMP/PKA signaling transduction pathway. 3 × 10⁶ RAW cells were pretreated with various amounts of H89 as indicated for 60 min, then stimulated with LPS (1 μg/ml) or LPS plus 400 μl 4T1 TCM (A) or PGE2 (10−12 M) (B) for 4 h, followed by collection of total RNA to measure p19 mRNA expression by qRT-PCR. (C) Different amounts of Forskolin as indicated were added to LPS-stimulated RAW cells for 4 hours to measure p19 mRNA expression by qRT-PCR. The same amount of dissolvent, DMSO was used as a negative control. (D) 10 × 106 RAW cells were transiently transfected with 5 μg of mouse p19 luciferase reporter construct. The transfected cells were pre-treated with different amounts of H89 as indicated for 60 min, then stimulated with LPS (1 μg/ml) or LPS plus 400 μl of 4T1 TCM for additional 7 h, followed by measurement of luciferase activity in cell lysates. qRT-PCR data were normalized relative to GAPDH mRNA expression levels in each respective sample and further normalized to the sample from the untreated group, which was set as 1. Data shown are means plus SD of 3–4 independent experiments ***: p<0.001 between two groups as indicated. Statistical analyses were performed between H89 or Forskolin treated group and LPS plus TCM and dissolvent groups.