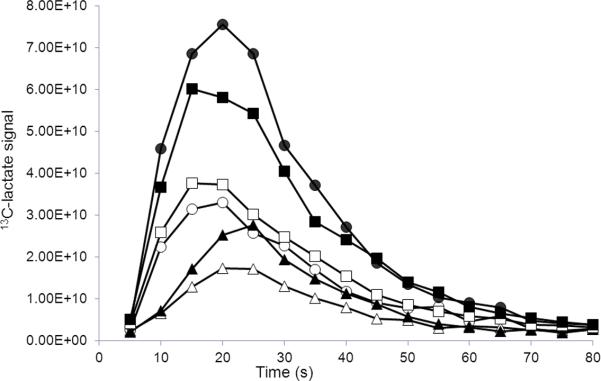
Figure 3.

Comparison of time-resolved [1-13C]lactate signals from liver (triangles), kidney (circles) and vascular (squares) regions of interest collected following injection of 80 mM [1-13C]pyruvate with (black filled) and without (open) 40 mM sodium lactate added to the dissolution buffer.
