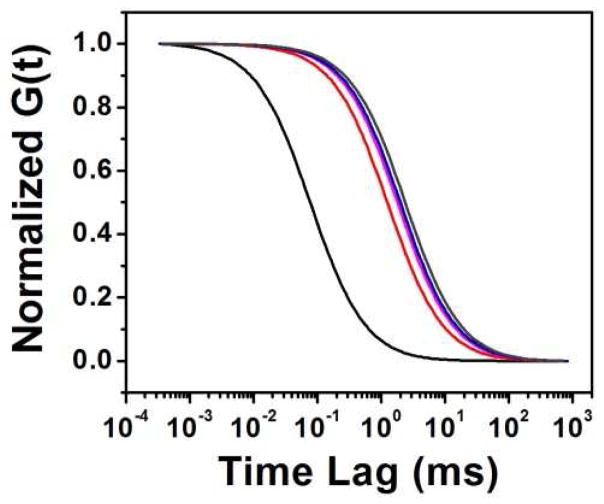
Figure 4.
Changes in diffusion rate with the suppression of background. The lines represent single component diffusion models fit to data collected from one experiment with combination HA-ADOTA and Rh 123 combination. The un-gated data (black) shows much faster diffusion, as Rh123 is more prominent. The apparent diffusion slows as Rh123 is suppressed with time gating at 5 ns (red), 55ns (magenta). The diffusion model resulting from the FLCS procedure (blue) is also shown along with that of a pure HA-ADOTA solution (dark gray).

