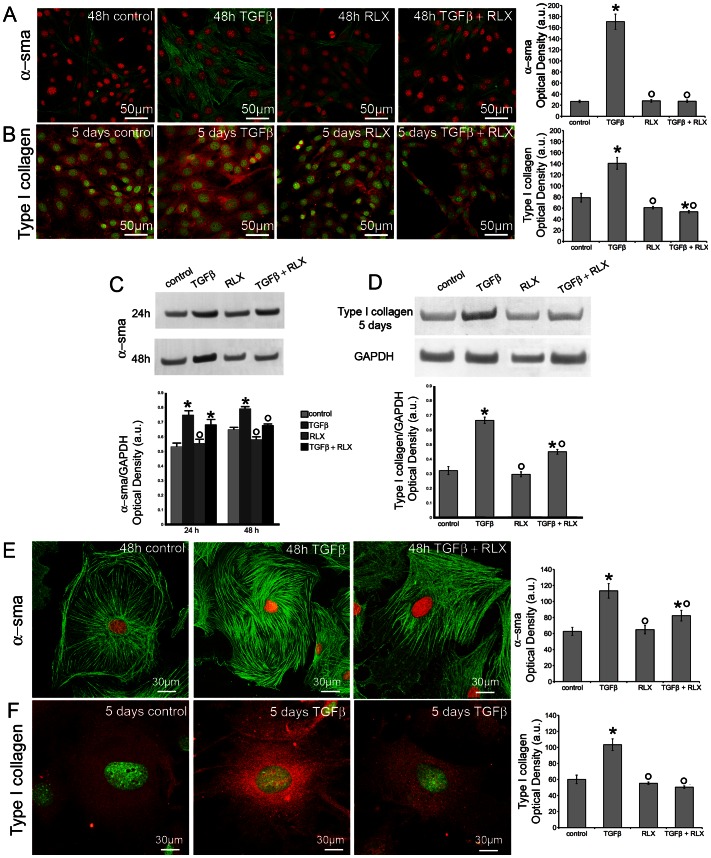
Figure 3. Relaxin reduces α–sma and type I collagen expression in TGF-β1 treated NIH/3T3 and primary neonatal cardiac fibroblasts.
A,B, E,F) Representative confocal immunofluorescence images of NIH/3T3 cells (A,B) and primary cardiac fibroblasts (E, F) cultured in the indicated experimental conditions and immunostained with antibodies against α–sma (A,E; green) or type I collagen (B, F, red). Nuclei are labeled (A,E) with propidium iodide (red) or with (B,F) Syto16 (green). The histograms show the corresponding densitometric analyses of the intensity of α–sma and type I collagen fluorescence signals. C,D) Western blotting analyses of the expression of α–sma and type I collagen proteins in neonatal cardiac fibroblasts. The densitometric analysis of the bands normalized to GAPDH is reported in the histograms. Data are representative of at least three independent experiments with similar results. Significance of differences: *p<0.05 vs control, °p<0.05 vs TGF-β1.

