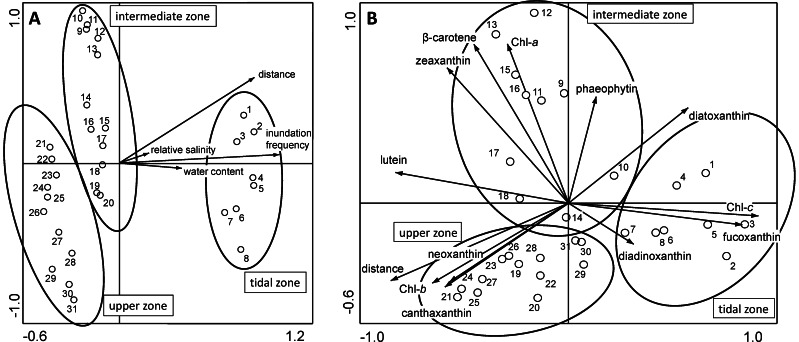
Figure 6. RDA plot of bacterial community DGGE profiles of the transect samples along with the most significant environmental parameters (A) and pigments (B).
The ovals around the groups indicated the independent clusters of samples from the different mat types. Eigenvalues for axes 1 and 2 in A are 0.1611 and 0.1163, respectively, accounting for 28% of the total variance and in B are 0.1795 and 0.1082 respectively, accounting for 29% of the variance in the DGGE pattern data.

