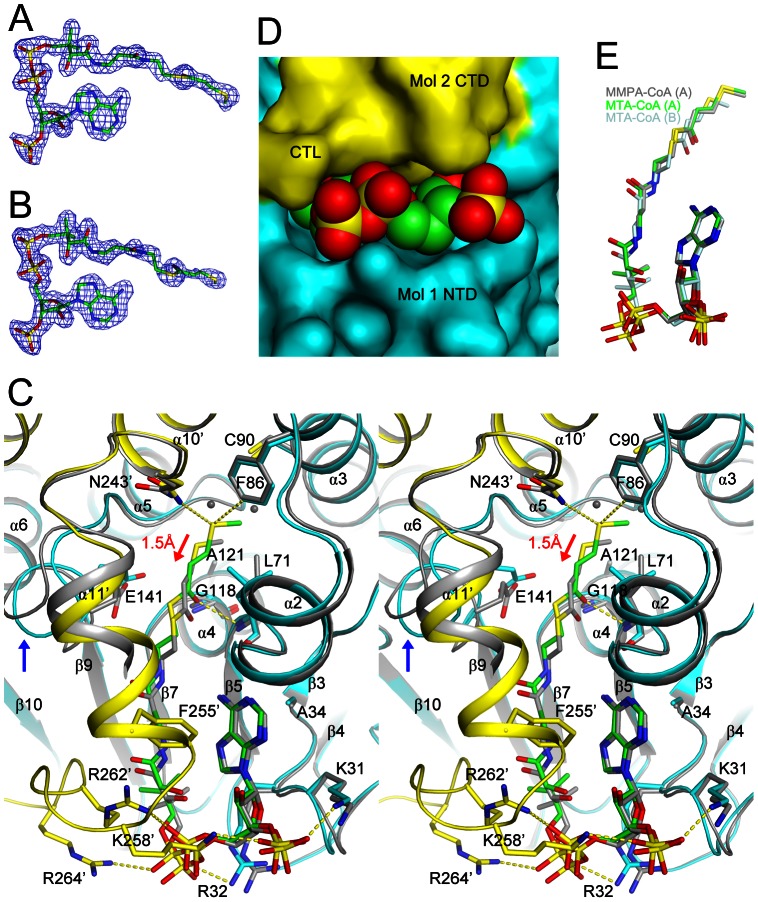
Figure 4. The active site of DmdD.
(A). Omit Fo–Fc electron density map at 1.8 Å resolution for MTA-CoA in binding mode A, contoured at 3σ. (B). Omit Fo–Fc electron density map for MTA-CoA in binding mode B, contoured at 2.5σ. (C). Overlay of the two DmdD active sites in the crystal of the E121A mutant in complex with MTA-CoA (in stereo). For binding mode A, molecule 1 of DmdD is shown in cyan, molecule 3 in yellow, and MTA-CoA in green. The MTA-CoA molecule in binding mode B and the corresponding binding residues in DmdD are shown in gray. The red arrow indicates the shift in the position of MTA-CoA in binding mode B relative to binding mode A. The blue arrow indicates conformational differences for the β9-α5 loop (include Glu141) between the two DmdD molecules. Close neighbors of the sulfur atom in binding mode A are indicated with the dashed lines (yellow). (D). Solvent accessible surface of the active site region of DmdD, corresponding to binding mode A of MTA-CoA (in green). (E). Overlay of binding modes A (in green) and B (in light cyan) of MTA-CoA and binding mode A of MMPA-CoA (in gray).

