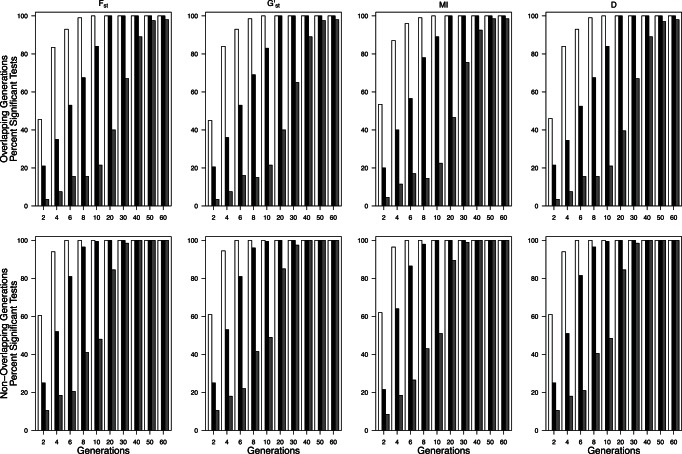
Figure 7. Percentage of 200 replicate runs that yielded significant θ, G’st, MI, and Dest_Chao values beginning at two generations after the cessation of migration from panmixia for 20 sampled individuals and 10 sampled loci in populations overlapping generations and non-overlapping generations.
Open bars N max = 500, closed bars N max = 1000, gray bars N max = 3000.

