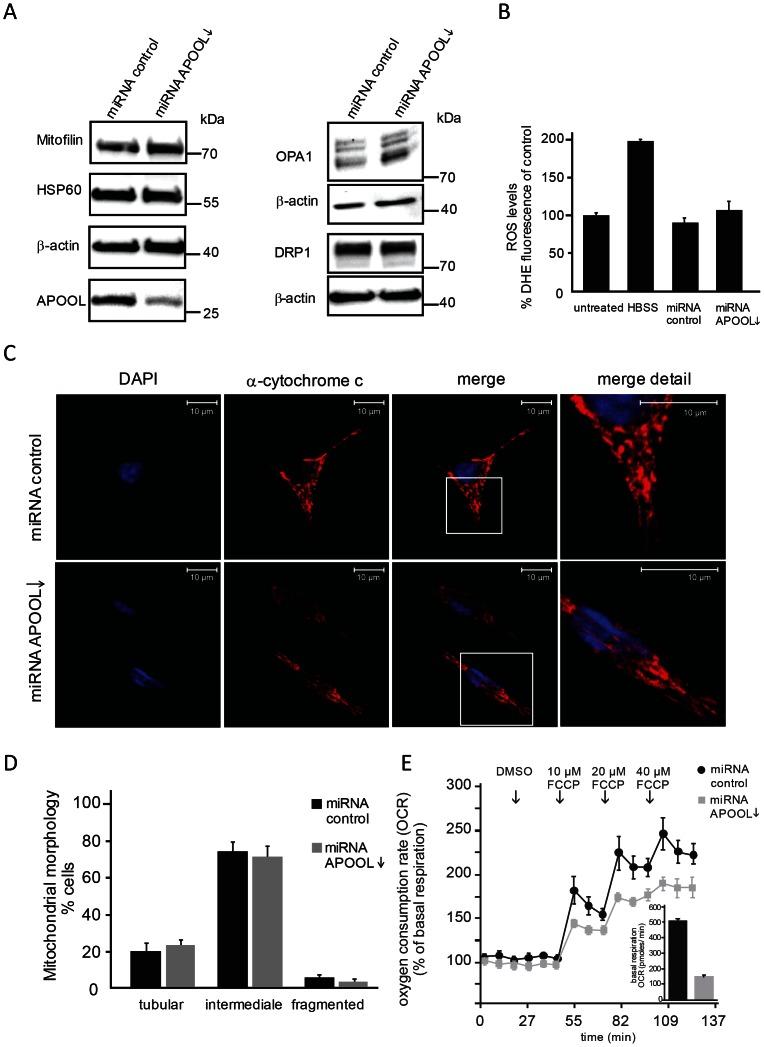
Figure 6. Downregulation of APOOL leads to a decreased basal mitochondrial oxygen consumption rate.
A, Western Blot analysis of total cell extracts of HeLa cells after transfection with plasmid DNA encoding miRNA against APOOL or control miRNA. B, Analysis of ROS formation. HeLa cells have been analyzed by assessing the formation of DHE derived fluorescence. HeLa cells showing low levels of APOOL as well as their corresponding transfection control, untreated cells, or cells starved by incubation for 4 h in HBSS (HBSS) prior to DHE treatment have been analyzed. The results are shown as mean ± s.d. (n = 4). C, Immunofluorescence microscopy of HeLa cells stained with an antibody against mitochondrial cytochrome c. Nuclear DAPI staining is shown in blue. 1st panel, DAPI (blue); 2nd panel, α-cytochrome c (red); 3rd panel, merge; 4th panel, blow-up of indicated white box in 3rd panel. D, Quantification of mitochondrial morphology. Mitochondrial morphology of the experiment described in panel C was determined from three independent experiments. 70 to 120 cells were analyzed for each experiment and results are shown as mean ± s.d. (n = 3). Quantification was performed using three categories: tubular, intermediate and fragmented (see methods section). E, Determination of oxygen consumption rate (OCR) relative to DMSO and basal respiration (inlay). Increasing FCCP concentrations have been applied at indicated time points. For APOOL downregulation and miRNA control, HeLa cells were transfected twice prior to analysis.

