
Figure 5. Relative quantity of P. falciparum sporozoite genome over that of An. gambiae genome.
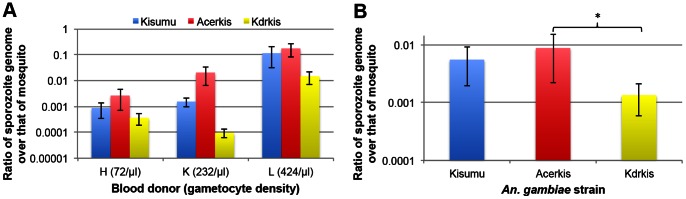
Panel A shows histograms presenting the ratio of sporozoite genome over that of mosquito genome for each mosquito strain and for each feeding assay. The gametocyte density for each blood donor (/µl of blood) is indicated in brackets. Panel B presents the ratio of sporozoite genome over that of mosquito genome for each mosquito strain among all 6 feeding assays. Bars above and below the means represent the standard errors of the mean. Tests of significance were corrected for multiple testing using the Bonferroni procedure. Stars indicate the significance level: one star for p<0.05; two stars for p<0.01; three stars for p<0.001.