
Figure 4.
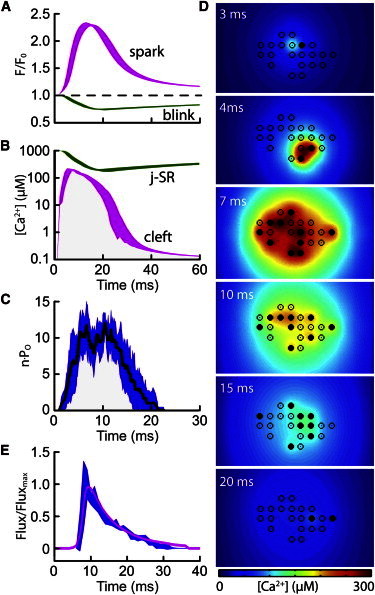
RyR cluster behavior during Ca2+ sparks. (A) Ca2+ spark and Ca2+ blink time courses for a cluster of 21 RyRs with a distribution as shown in D. (B) Spatial mean of [Ca2+] in the dyadic cleft and j-SR. (C) Numbers of open RyRs corresponding to the means in B. In A–C, line thickness shows the SD of 10 simulations. (D) Spatial distribution of [Ca2+] in the dyad at several time points during a typical simulation. RyRs are located at the circles, with solid and open circles representing open and closed RyRs, respectively. (E) Simulated time course of j-SR Ca2+ flux (wide trace) compared to the Ca2+ flux calculated from experimental Ca2+ spark profiles (line) replotted from Soeller and Cannell (43).