
Figure 5.
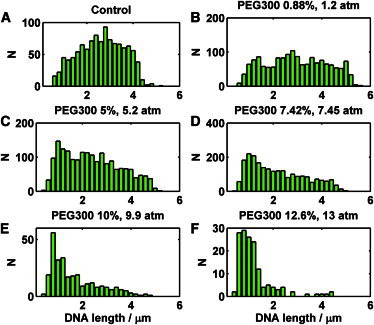
Ejected DNA length histograms in varying concentrations of PEG300. All experiments were done in 10-fold diluted His1 buffer. (A) The control experiment contained no PEG300. (B) Experiment with 0.88% PEG300 corresponding to 1.2 atm. (C) Experiment with 5% PEG300 corresponding to 5.2 atm. (D) Experiment with 7.42% PEG300 corresponding to 7.45 atm. (E) Experiment with 10% PEG300 corresponding to 9.9 atm. (F) Experiment with 12.6% PEG300 corresponding to 13 atm.