
Figure 5.
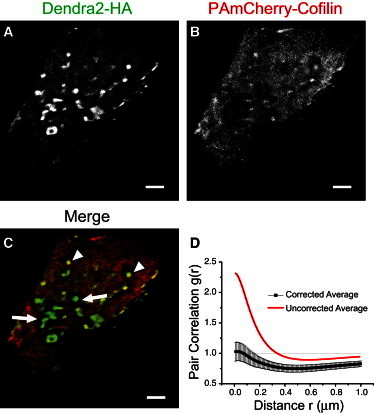
Cofilin is differentially excluded from HA clusters. Clusters of Dendra2-HA and PAmCherry-cofilin were imaged by two-color FPALM in fixed NIH3T3-HAb2 cells. (A, green channel) Clusters of HA span a range of length scales. (B, red channel) Cofilin was dispersed diffusely throughout the cell, except for areas surrounding HA clusters. (C) Merge. Extending hundreds of nanometers to micrometers from the periphery of HA clusters was typically a zone excluding cofilin (white arrows), although this pattern was not absolute. Some small HA clusters colocalized with cofilin clusters (white arrowheads). These images were taken at the bottom membrane with an effective focal depth of ±0.5 μm. Scale bar = 2 μm. (D) The pair-cross-correlation function for HA and cofilin depends strongly on bleed-through correction. The uncorrected curve (red line) overestimates correlation and underestimates anticorrelation. The corrected (black points ± SE, n = 14 fixed cells) shows significant anticorrelation, especially on length scales of ∼600 nm.