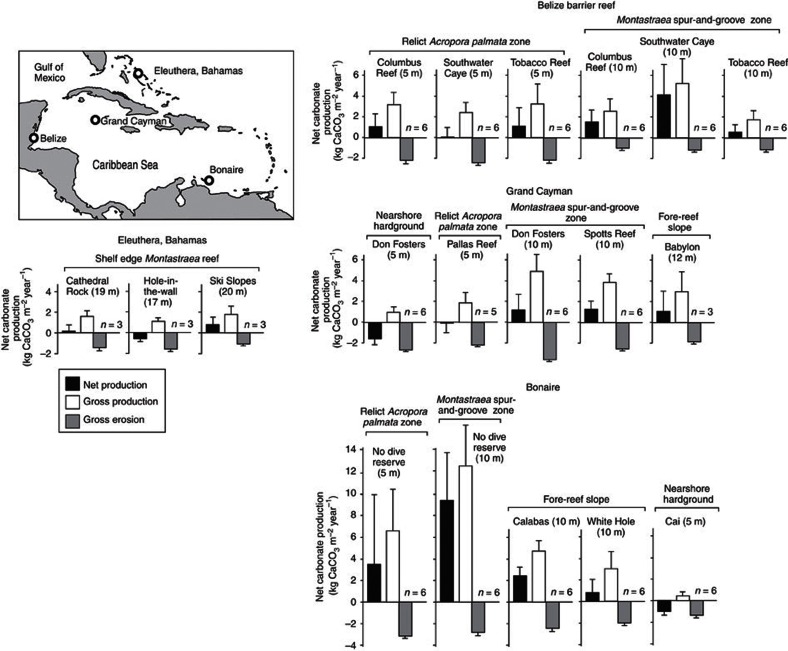
Figure 1. Caribbean study sites and reef carbonate production rates.
Location of study sites across the Caribbean and plots showing gross carbonate production and erosion, and net production rates (kg CaCO3 m−2 year−1) for each study reef. Data are grouped by country. n=number of transects per reef site.

