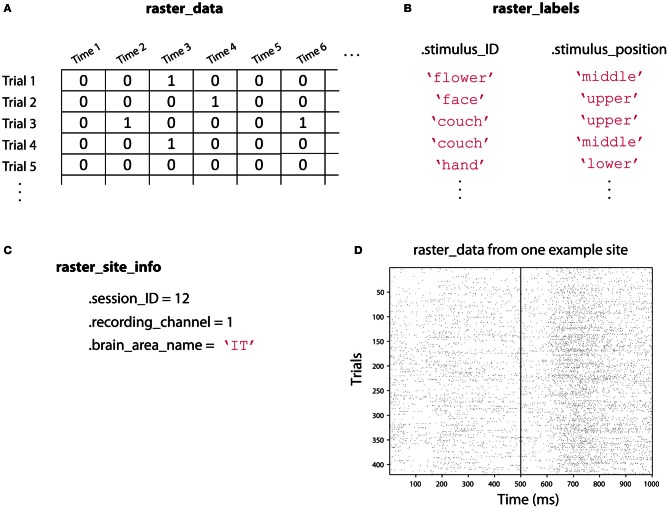
Figure 3.
An illustration showing the three raster-format variables. (A) raster_data is a [number-of-trials × number-of-time-points] matrix that contains the data from the neural recordings. Here we illustrate spiking data where a one indicates that an action potential occurred at a particular point in time, but this matrix could contain real values such as EEG voltage recordings. (B) raster_labels is a structure where each field in the structure contains a [number-of-trials × 1] cell array of strings that indicates which experimental condition occurred on each trial. Here we have two types of labels: .stimulus_ID which indicates which image was shown on a particular trial, and .stimulus_position which indicates where the stimulus was shown on the screen. (C) raster_site_info contains any additional useful information about the recorded site. Here we include which recording session the data comes from, which channel was used for the recoding, and the brain area where the recording was made. (D) An example of the raster_data from one site from the Zhang–Desimone seven object dataset created using the function imagesc(~raster_data); colormap gray. Spikes are indicated by black marks. Files in raster-format need to be converted into binned-format before they can be used for decoding, which is typically done using the tool create_binned_data_from_raster_data.

