Figure 4.
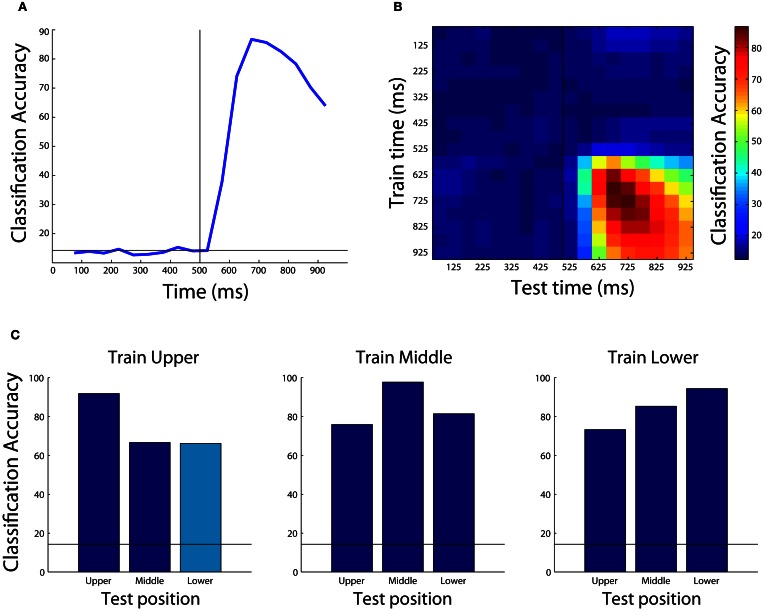
Examples of results that can be obtained using the Neural Decoding Toolbox. (A) Basic classification accuracy results from decoding which object was present using the Zhang–Desimone seven object dataset. As can be seen, prior to the onset of the stimulus (black vertical line at 500 ms) the decoding accuracy is at chance (black horizontal line) and it rises quickly after stimulus onset. (B) Results examining whether information is contained in a dynamic population code that are obtained by training the classifier at one time period (y-axis) and testing the classifier at a second time period (x-axis). The results here show there are some dynamics to the population code, as can be seen by the fact that the some of the highest decoding accuracies occur along the diagonal of the plot, however, overall there dynamics appear weak compared to those seen in other studies (Meyers et al., 2008, 2012; Crowe et al., 2010; Carlson et al., 2011; Isik et al., 2012). (C) Results showing that IT populations are highly invariant to changes in the position of the stimulus. Each subplot shows the results from training the classifier using data from objects shown at one position, and each bar shows the results from test the classifier with data from either the same position or at a different position (the cyan bar shows the results generated by the code in the text). As can be seen, the best results are usually obtained when the classifier is trained and tested with data from the same position, however, even when the classifier is tested with data from a different position, the results are well above chance (black horizontal line) showing that the neural population represents objects similarly across different positions.

