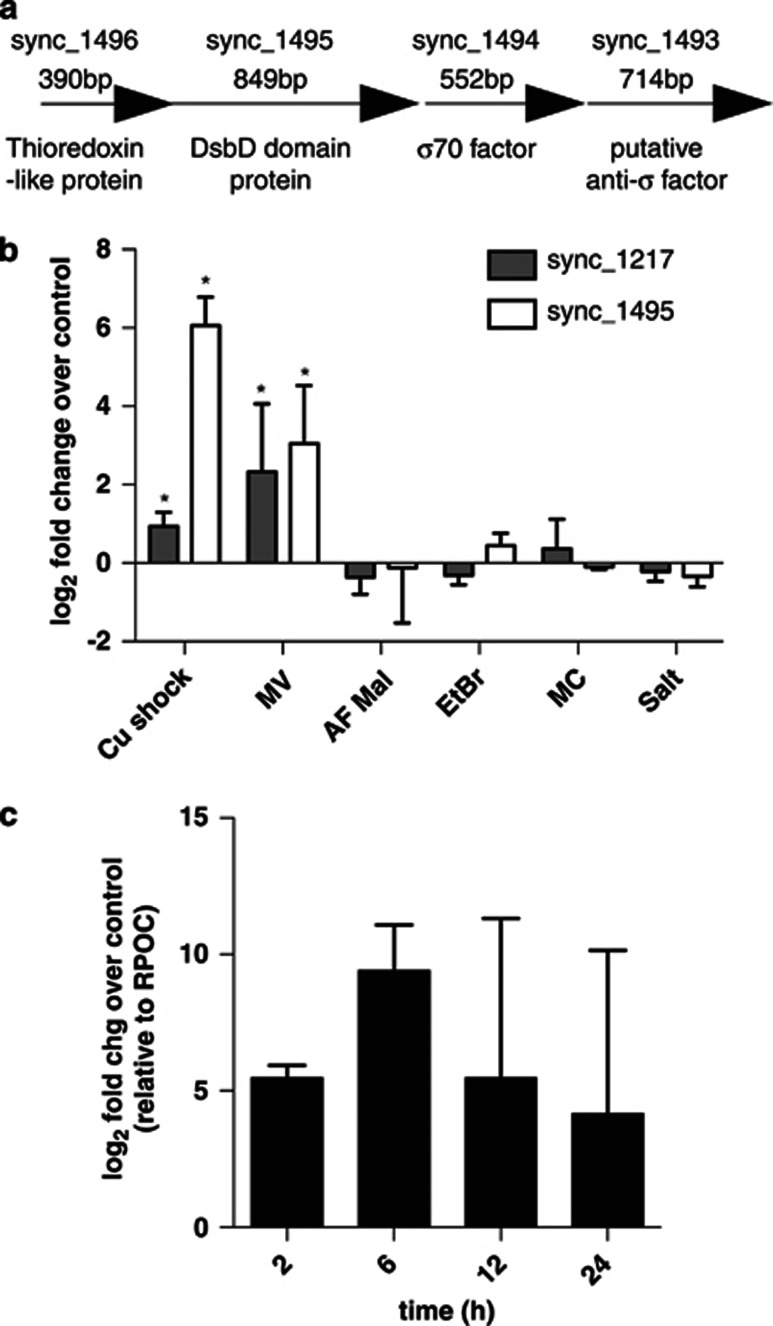
Figure 1.
Sync_1495 gene expression in response to stressors and over time. (a) is a schematic of the operon sync_1496−1493. (b) is gene expression in response to various stressors. Log2 fold change is calculated relative to a control treatment. Error bars represent one s.d. between three biological replicates. ‘Cu' is quantitative reverse transcription (RT)-PCR after 2 h of copper addition (pCu10.1, 10 μℳ CuEDTA), ‘MV' is qRT-PCR of methyl viologen treatment 2 h after addition (100 nℳ). ‘AF Mal' is qRT-PCR AlexaFluor-488 C5 maleimide 2 h after addition (1 μℳ). ‘EtBR', ‘MC' and ‘salt' are microarray expression data (S Tetu, D Johnson, K Phillippy, R Stuart, C Dupont, K Hassan, B Palenik and I Paulsen, unpublished data). (c) is gene expression of sync_1495 over 24 h after copper stress (pCu10.1, 10 μℳ CuEDTA).

