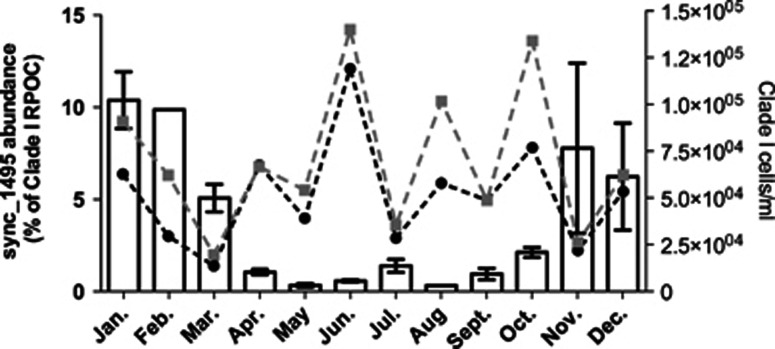
Figure 4.
Temporal distribution of sync_1495 gene over 2 years off the Scripps Institution of Oceanography pier. Bars show qPCR of sync_1495 as a percentage of total Clade I Synechococcus abundance (as determined by Clade I rpoc1 abundance) in surface samples from 2005 and 2007. Error bars represent +/− one s.e.m. between 2 replicate years (2005 and 2007). For Feb. and Aug. months no data was available for 2005 and only 2007 value is shown. Lines show Synechococcus abundance data from Tai et al., 2009; black line shows Clade I total abundance from qPCR and gray line shows total Synechococcus numbers from flow cytometry.

