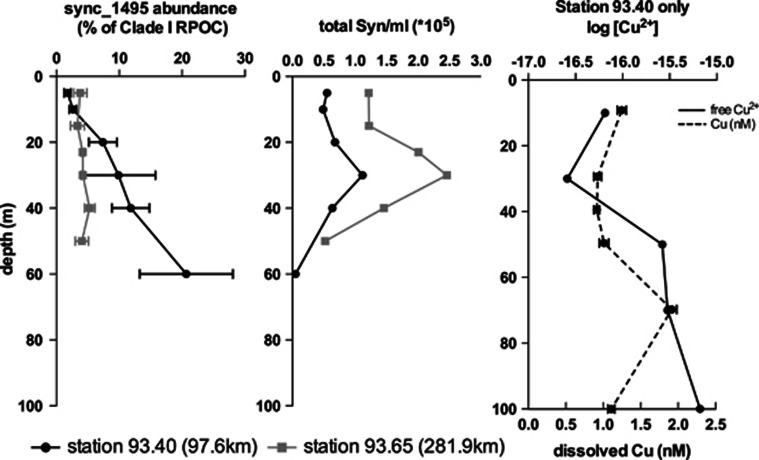
Figure 5.
Spatial distribution of sync_1495 gene from two stations in the Southern California Bight. Numbers in parentheses indicate distance from shore. Left vertical profile shows qPCR of sync_1495 as a percentage of total Clade I Synechococcus abundance (as determined by Clade I rpoc1 abundance). Error bars represent one s.d. between three technical replicates. Middle profile shows Synechococcus counts from flow cytometry taken from Tai et al., 2011. Right profile shows both total dissolved copper concentration (dashed line) and free copper (-log[Cu2+]) concentrations (solid line). -log[Cu2+] measurements from copper speciation using CLE-ACSV at 25 μℳ SA (Buck et al., 2010).

