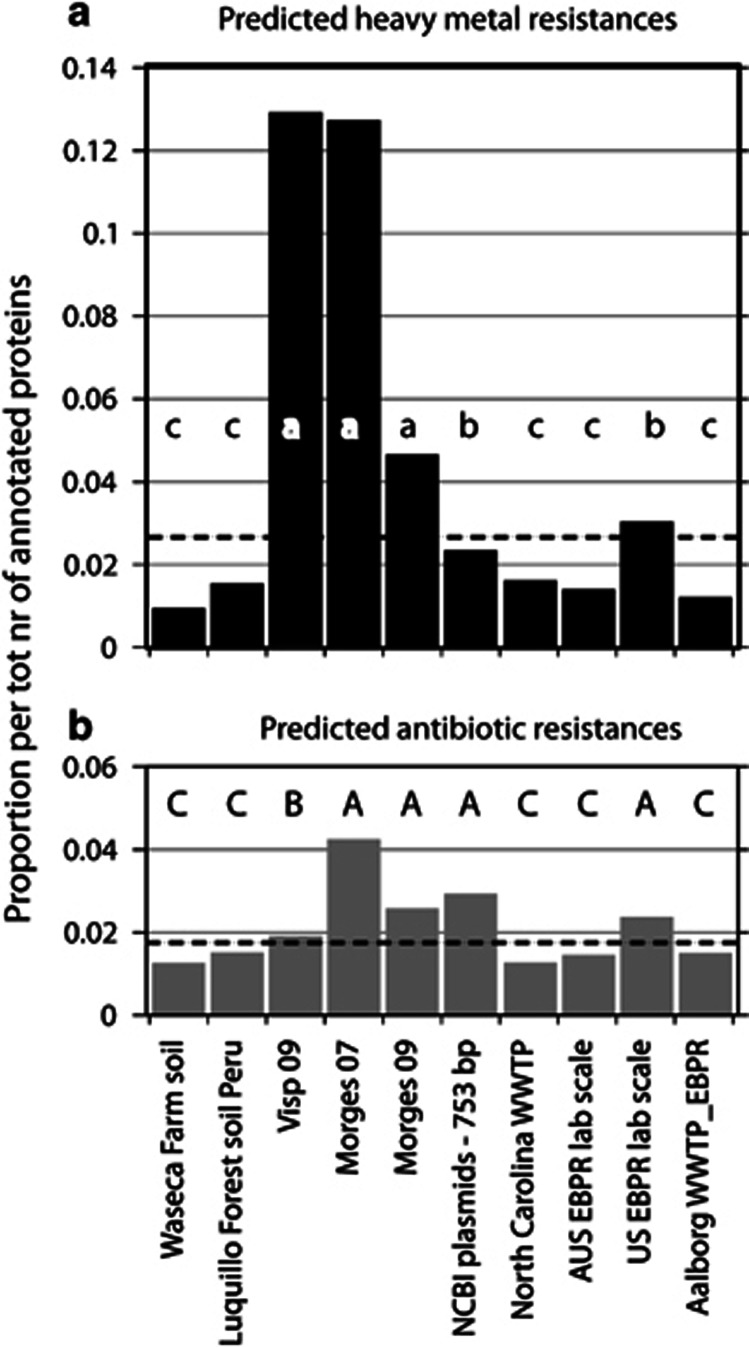
Figure 5.
Comparison of proportional abundances of genes for heavy metal (a) and antibiotic resistance (b) in the Morges and Visp CCSD metagenomes. Proportions are calculated as the number of predicted proteins in each category compared with the total number of annotated proteins in the respective metagenome using MG-RAST subsystems classification (Meyer et al., 2008). The distribution of resistance proteins differs significantly between samples (χ2 test P<2·10−16). Letters indicate strong deficit (c, C), large excess (a, A) or little difference (b, B) compared with the χ2 expectation. The dotted lines indicate the computed average proportion corrected for the sample size.

