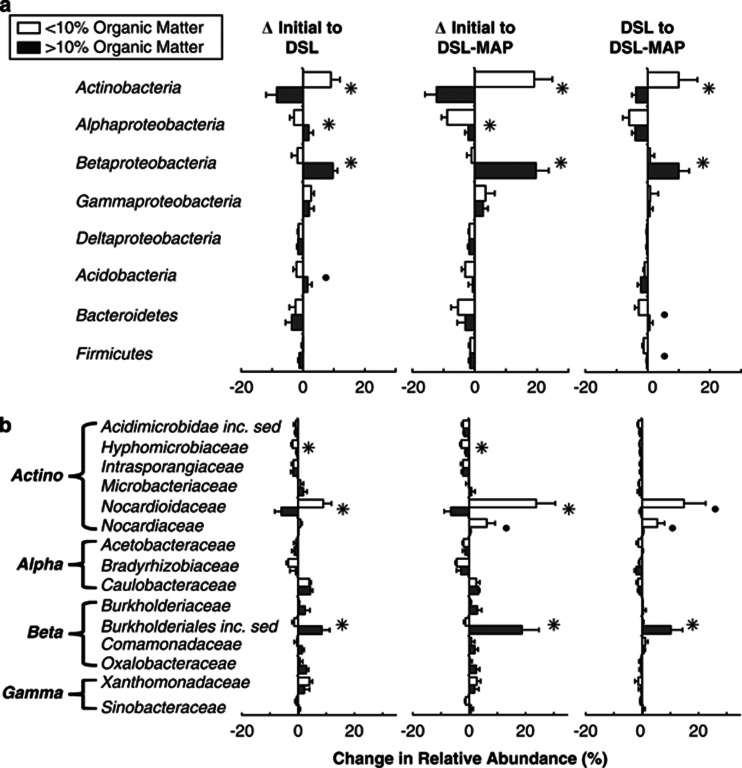
Figure 4.
Percent shifts in the DSL and DSL–MAP soils in the relative abundance of classified sequences of (a) the major phyla (and classes of Proteobacteria), and (b) families of Actinobacteria and Proteobacteria that were among the ten most abundant in at least one of the treatments. Significant differences in sequence abundance shifts between soils with low- and high-organic matter content are denoted by stars (P<0.05) or circles (P<0.10) as determined by the Student's t-test.

