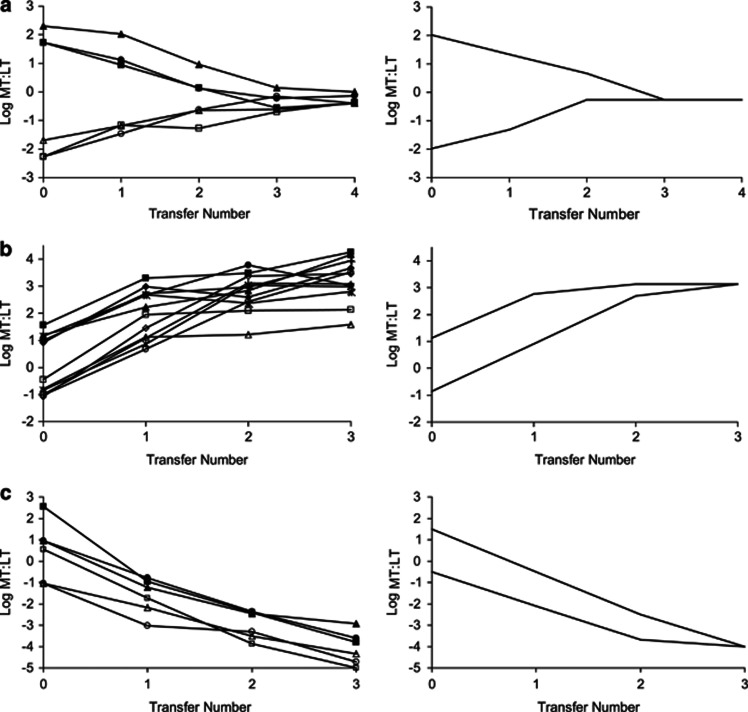
Figure 4.
Results of representative competition experiments among putative ecotypes. Each pair of strains is indicated by a unique symbol; the symbol is filled for experiments started at a high MT:LT ratio, and the symbol is open for experiments started at a low ratio. All competition results are summarized in Supplementary Tables 3–5 and are shown in Supplementary Figures 3–5. In each panel, the left figure shows the results for each pair of strains, and the right figure shows the best-fitting model, based on the average results over all strain pairs. The three pairs of putative ecotypes displayed, all from community A, are as follows: putative ecotypes A1a and A1b (a); putative ecotypes A1a and A2 (b); putative ecotypes A2 and A1b (c).

