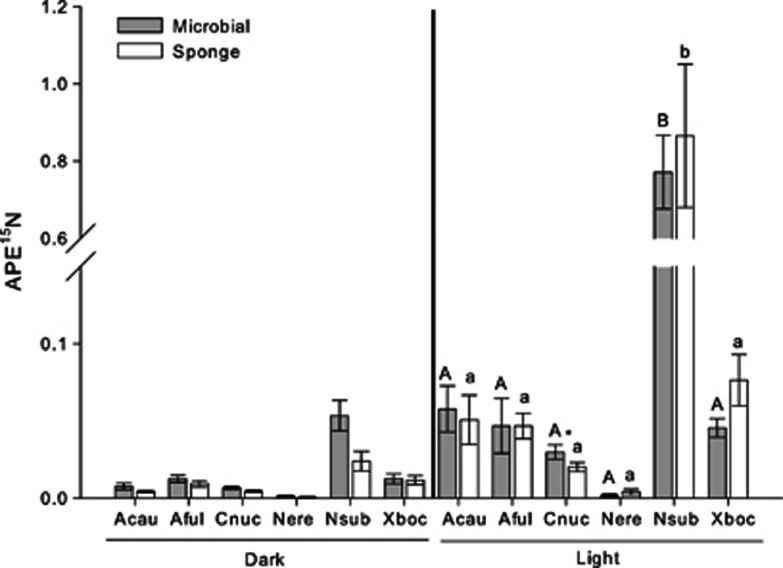
Figure 2.
Mean (±s.e.) APE15N values for microbial and sponge cell fractions from six species of sponges held in light (clear) and dark (amber) bottles. Values from the dark treatment are included for reference. Different letters within columns indicate statistically significant differences in the APE15N of the sponge (lower case) or microbial fraction (upper case) as determined by ANOVA on each fraction followed by an LSD multiple pairwise comparison. An asterisk indicates significantly different APE13C values between the fractions of one species. Abbreviations of species names and sample sizes are identical to Figure 1.

