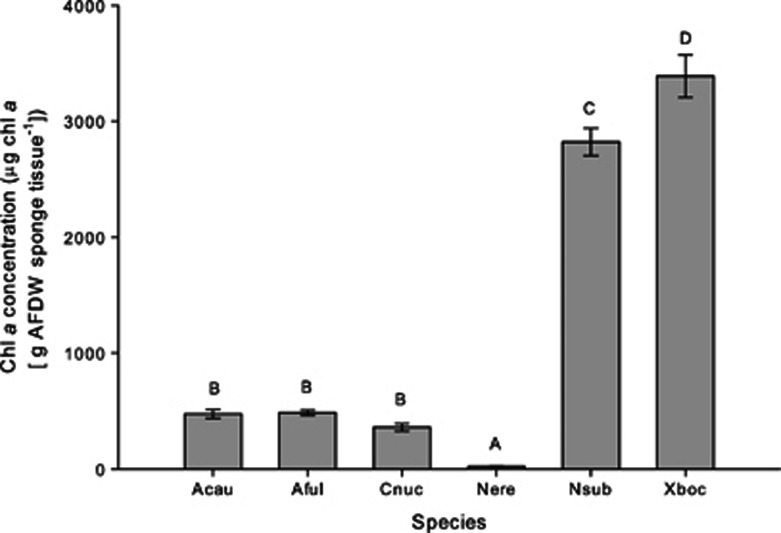
Figure 3.
Mean (±s.e.) chl a concentrations across six species of sponges. Values are for bulk sponge tissue. Different letters above each species indicate statistically significant differences across species as determined by GLM followed by LSD multiple pairwise comparisons. Abbreviations of species names are identical to Figure 1. N=5 for all species.

