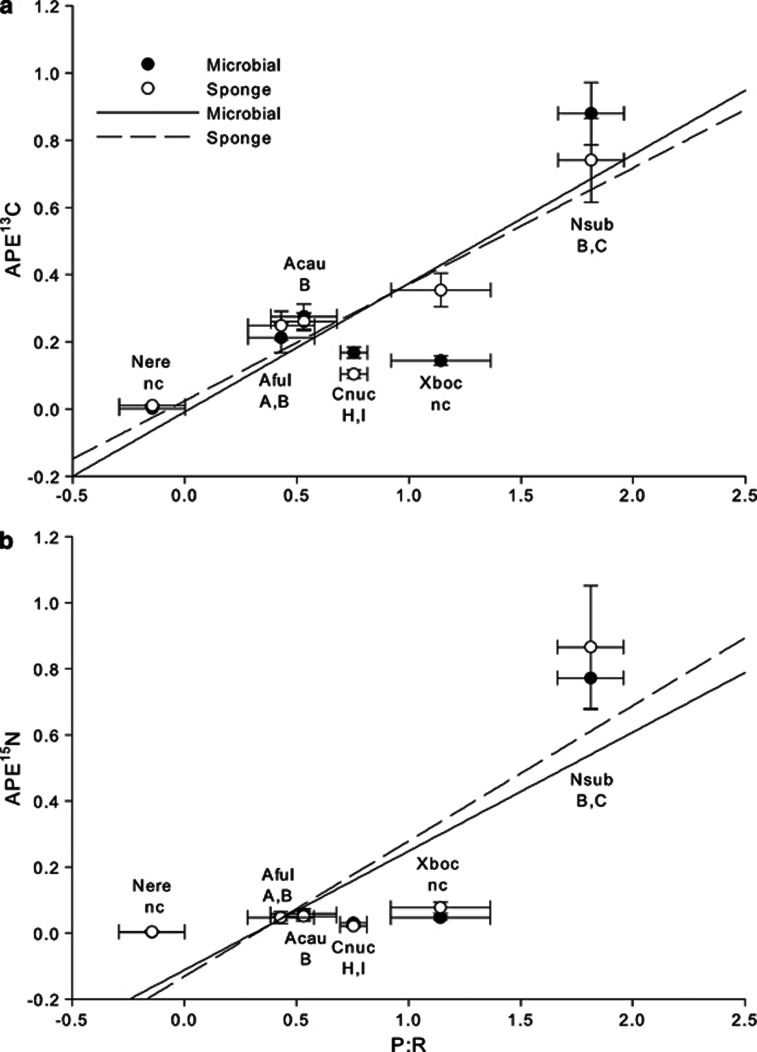
Figure 5.
Sponge and microbial fraction enrichment measured in APE13C (a) and APE15N (b) as a function of photosynthesis to respiration (P:R) ratios. APE13C and APE15N values for each fraction are means (±s.e.), while P:R ratios are adjusted least-square means (±s.e.). S. spongiarum clades are displayed for all sponges hosting unicellular cyanobacterial symbionts based on Erwin and Thacker (2007); nc denotes sponges that do not host S. spongiarum clades. Abbreviations of species names are identical to Figure 1. Sample sizes for APE and P:R ratios match those from Figures 1, 2 and 4. In each plot, the dashed line represents data from the sponge fraction and the solid line represents data from the microbial fraction.

