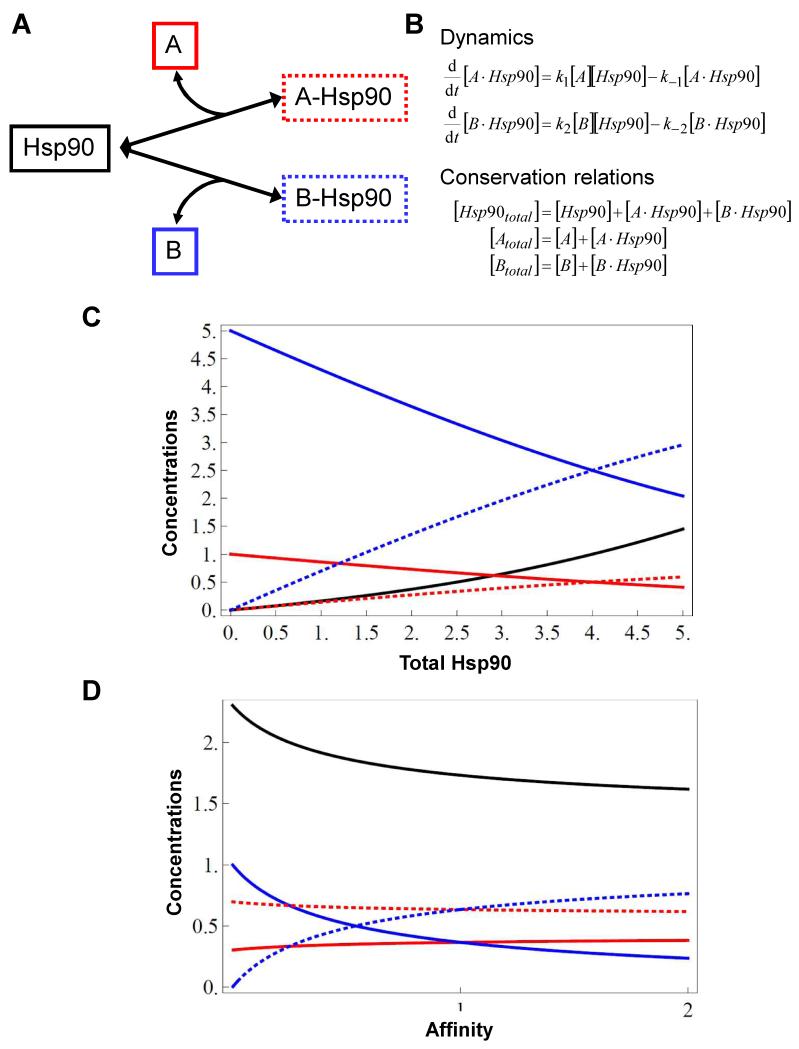
Figure 4. Alterations in Hsp90 concentrations are predicted to differentially affect interactions with specific Hsp90 client proteins.
(A) A simple conceptual network illustrating the interactions between Hsp90 (black) and two distinct client proteins, A (red) and B (blue). The solid boxes surround the free forms of these proteins, and the dotted boxes surround the A-Hsp90 and B-Hsp90 client-chaperone complexes. (B) Equations describing the dynamic relationships between these proteins and complexes in this conceptual network, and their conservation in the network. In steady state, set the two dynamic equations equal to zero. (C) Graph showing the impact of changing total Hsp90 levels on the concentrations of the free and Hsp90-bound forms of the client proteins A and B. In this case the affinities of Hsp90 for A and B are the same, but the total concentration of A is five-fold lower than B. Clearly Hsp90 availability influences the proportions of A and B that are incorporated into Hsp90 complexes. (D) Graph depicting the effects of altering the affinity of Hsp90 for B (from 0 to 2), whilst the affinity of Hsp90 for A remains constant (=1) (p1 = k1/k−1 = 1; p2 = k2/k−2 = 0…2; [Atotal] = 1; [Btotal] = 1). As the affinity of Hsp90 for B increases, the concentration of the B-Hsp90 complex increases (dotted blue line) and the levels of free B (solid blue line) and free Hsp90 (solid black line) decrease. By contrast, the concentration of the A-Hsp90 complex remains relatively unaffected (dotted red line). Hence the proportions of A and B that are chaperoned by Hsp90 change as a result of this altered affinity for one of the client proteins. Solid and dotted red, blue and black lines correspond to those in (A).

