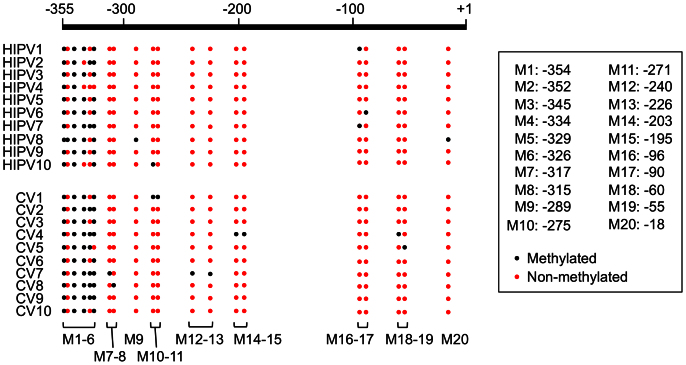
Figure 4. DNA methylation analysis of the TI gene.
Distribution of DNA methylation in the promoter region upstream of the predicted transcription start site (355 bp) in the HIPV-receivers (HIPV1 to 10) and CV-receivers (CV1 to 10) (ten independent sequences each). Black and red circles in the map indicate methylated and non-methylated Cyt, respectively.

