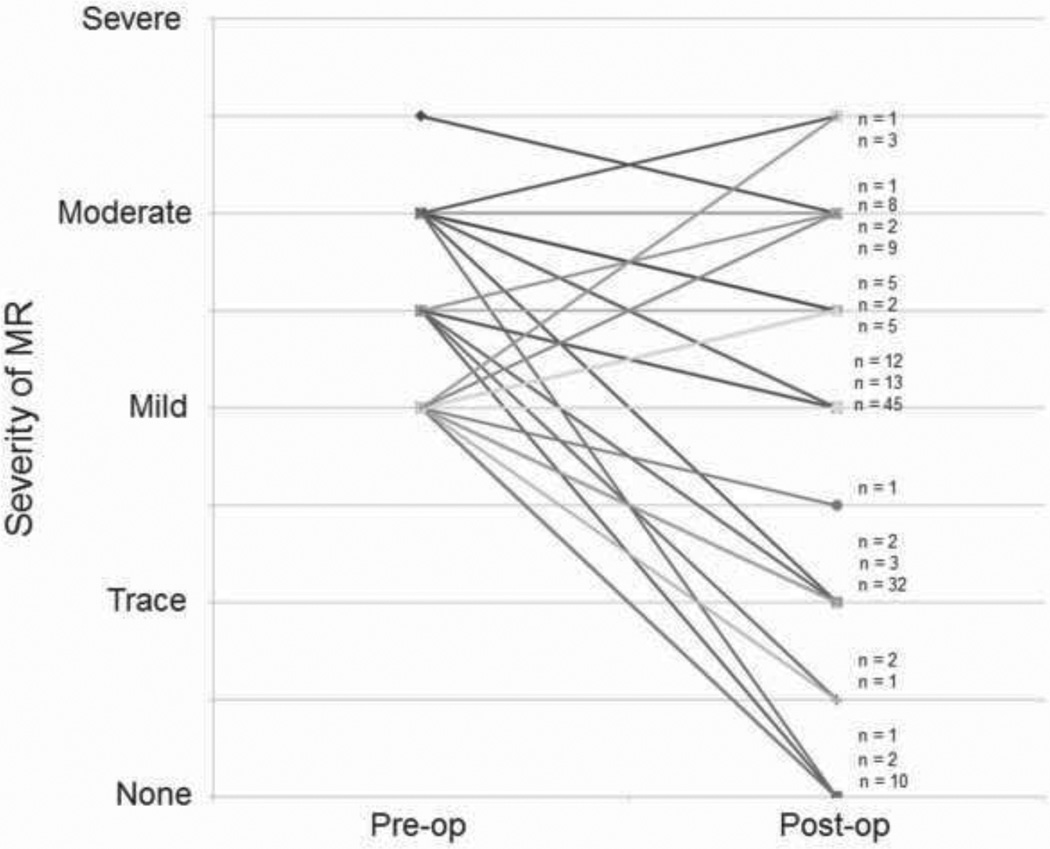
FIGURE 1. Trend plot of MR for patients undergoing AVR.
The pre-operative and post-operative grades of MR for individual patients undergoing AVR alone (without any concomitant procedure) that had at least mild pre-operative MR were plotted. Because there is substantial overlap of individual plots, n values are used to indicate the number of patients represented by each line.

