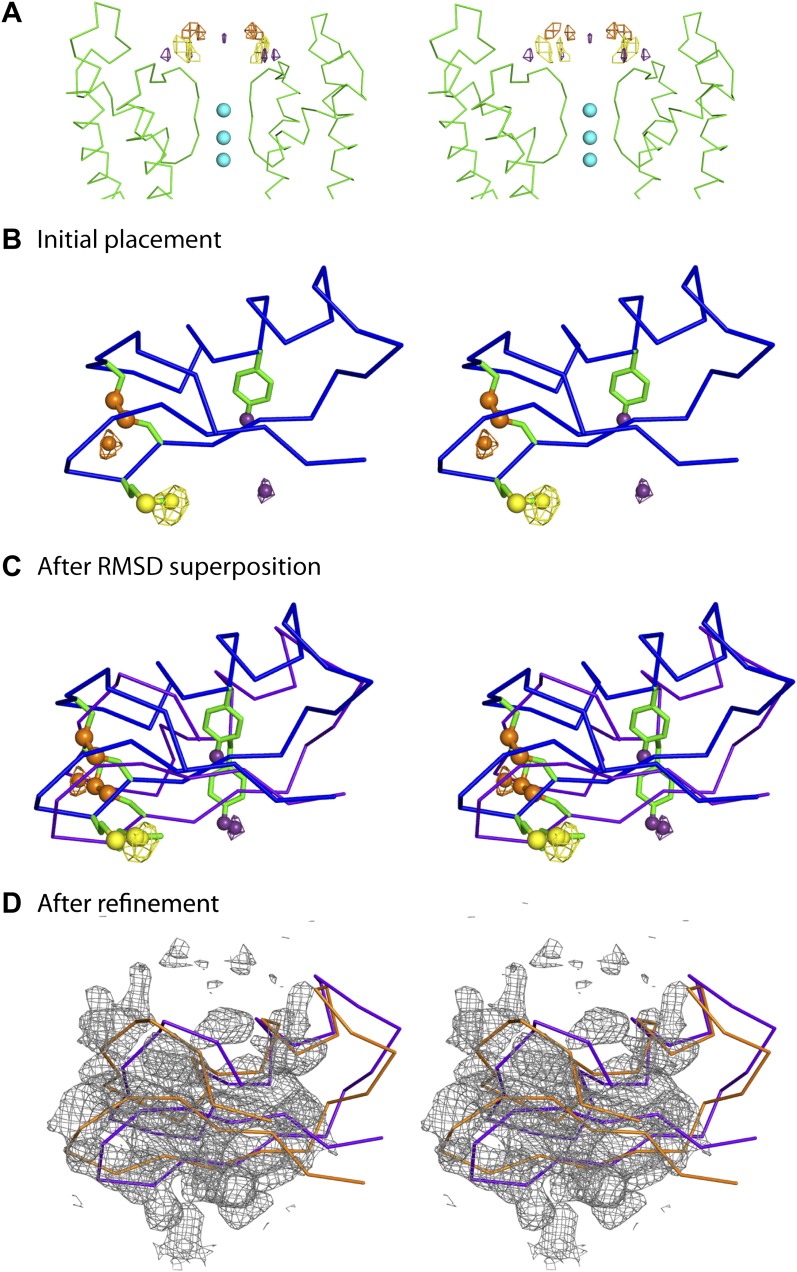
Figure 5. Improvement of the initial placement of the toxin.
(A) Close-up stereoview showing part of the pore domains from two diagonal subunits (molecule A) of paddle chimera. Peak positions from the anomalous electron density maps for the three derivatives (see Figure 4B) are shown and colored as follows—purple (4-iodophenylalanine mutant at position 14), orange (diselenide mutant of Cys7-Cys28), and yellow (SeMet mutant at position 29). Note that the four peaks correspond to the four positions of the toxin. In addition, the peak on the symmetry axis in the anomalous electron density map of the 4-iodophenylalanine mutant likely derives from reinforcement of noise peaks that are very close to the symmetry axis. (B) Stereoview showing initial placement of CTX in the omit map using the NMR structure (PDB ID 2CRD; Bontems et al., 1991), in blue α carbon trace (same as in Figure 4A). The heavy atoms in the depicted orientation are shown as oversized spheres with the corresponding peak positions (the closest of the four shown in Figure 5A) in the anomalous electron density maps in wire mesh. Color-coding of the maps are the same as in Figure 5A. A dummy atom has been placed to indicate the position of each peak. (C) The toxin molecule is shown in purple α carbon trace, after RMSD superposition of the heavy atom positions in the structure onto experimental peak positions as illustrated by the dummy atoms in Figure 5B. The initial placement of the toxin as shown in Figure 5B is also shown in blue. (D) The final refined model of the toxin after crystallographic refinement (please see text and ‘Materials and methods’) is shown in orange α carbon trace together with the model after initial RMSD superposition in purple and a weighted 2Fo − Fc electron density map in wire mesh at 1σ contour level.


