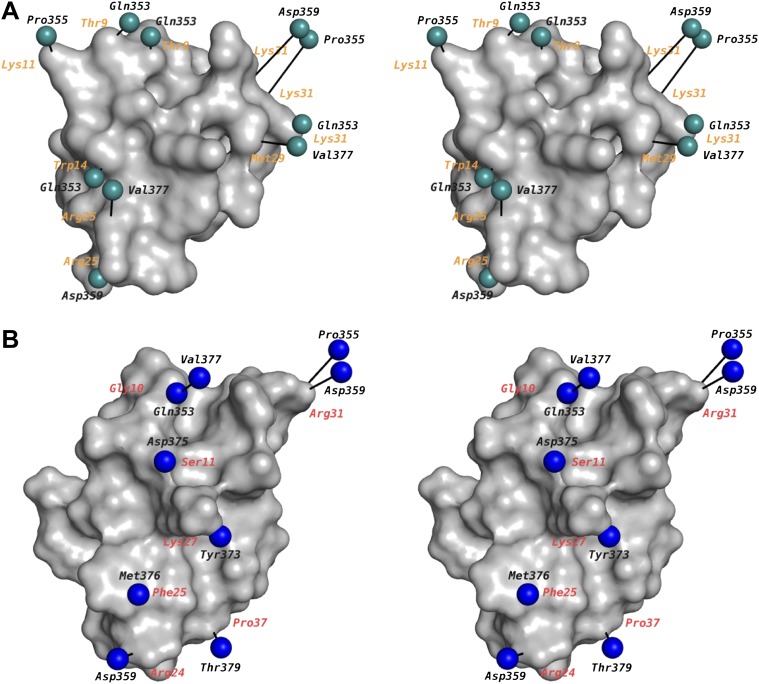
Figure 9. Mapping of toxin-channel interactions reported in literature on the structure of paddle chimera–CTX complex.
(A) Shown is a stereoview of the bound CTX in surface rendition in the CTX–paddle chimera structure from an intracellular perspective viewing down the fourfold symmetry axis of the channel (channel not shown). Residues in the channel that have been reported in the literature to be proximal to the toxin are represented as green spheres taking the coordinates of the closest atom from the structure of the CTX–paddle chimera complex (see text). They are connected to the corresponding residues in the toxin with a black line. The corresponding residues in CTX are indicated in orange. Note that certain residues on the channel have been reported to be proximal to multiple residues on the toxin and thus they are represented more than once in the map. This figure shows data derived with CTX. (B) Shown are the residues in AgTx2 reported in the literature to be proximal to the channel, in the same format as (A). In order to depict AgTx2, it was superimposed on CTX in the paddle chimera–CTX complex using the published NMR structure of AgTx2 (PDB ID 1AGT; Krezel et al., 1995) and using the guidelines in Krezel et al. (1995). AgTx2 is shown in surface rendition and the residues on the channel proximal to AgTx2 are shown as blue spheres. The corresponding residues in AgTx2 are indicated in red.

