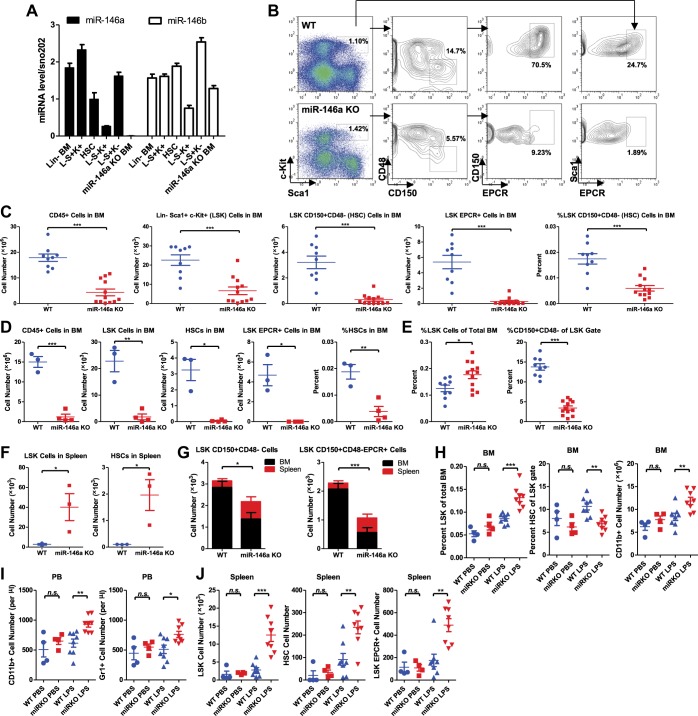
Figure 1. Accelerated HSC decline and myeloproliferation in miR-146a–deficient mice during chronic inflammation.
(A) MiR-146a and miR-146b expression in FACS-sorted HSPC populations by Taqman RT-qPCR. Lin-BM, lineage negative bone marrow cells; L−S+K+ (LSK), Lin−Sca1+cKit+; HSC, LSK CD150+CD48−; L−S−K+, Lin−Sca1−cKit+; L−S+K−, Lin−Sca1+cKit−; miR-146a KO BM, total bone marrow cells from Mir146a−/− mice. (B). Representative FACS plots of LSK cells and CD150+CD48− or EPCR+ HSCs from BM of 8-month-old wild-type (WT) and miR-146a KO mice. Quantification of number of BM CD45+ cells, LSK cells, LSK CD150+CD48− HSCs, LSK EPCR+ HSCs and percent of LSK CD150+CD48− HSCs of total BM from 8-month-old (C) and 12-month-old (D) WT and miR-146a KO mice by FACS. (E) Quantification of percent of LSK cells of total BM and percent of HSCs of LSK gate from BM of 8-month-old WT and miR-146a KO mice by FACS. (F) Quantification of number of LSK cells and LSK CD150+CD48− HSCs from spleen of 8-month-old WT and miR-146a KO mice by FACS. (G). Total number of LSK CD150+CD48− or LSK CD150+CD48− HSCs from BM and spleen of 6-month-old WT and miR-146a KO mice. (H)–(J) 8-Week-old WT and miR-146a KO (miR KO) mice were subjected to repeated low-dose of intraperitoneal LPS stimulation (1 mg LPS/kg of body weight for 8 times) or PBS control spread over a month. At the end the month, four groups of mice were harvested for FACS analysis. (H) Quantification of percent of LSK cells of total BM, CD150+CD48− HSCs of LSK gate, and number of CD11b+ myeloid cells in BM. I. Number of myeloid cells (CD11b+ or Gr1+) in peripheral blood. (J) Quantification of total number of LSK CD150+CD48− HSCs, LSK EPCR+ HSCs and LSK cells in spleen.


