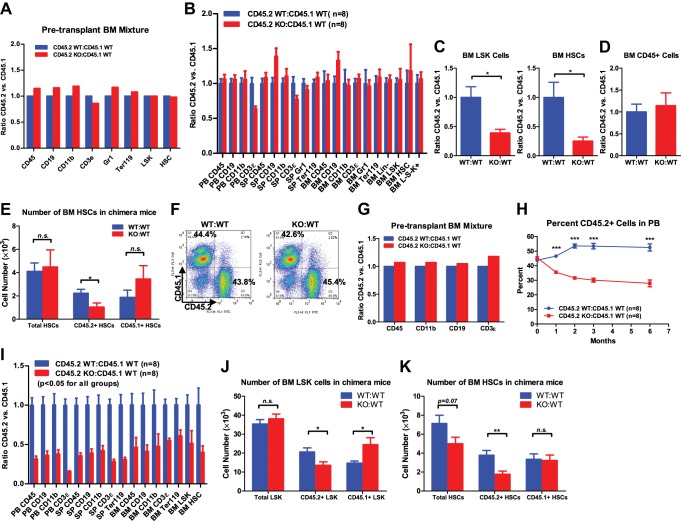
Figure 2. Progressive functional decline of miR-146a-deficient HSCs.
(A) Ratio of CD45.2+ over CD45.1+ cells of various lineages in pretransplanted bone marrow (BM) mixtures consisted of equal numbers of CD45.2+ WT and CD45.1+ WT total BM cells (blue bar, CD45.2 WT:CD45.1 WT) or equal numbers of CD45.2+ miR-146a KO and CD45.1+ WT total BM cells (red bar, CD45.2 KO:CD45.1 WT). FACS analysis was performed on the BM mixtures before transplantation to determine the starting ratios of various lineages. (B) Ratio of CD45.2+ over CD45.1+ cells of various lineages in peripheral blood (PB), spleen (SP) and BM 6 months after transplantation. Blue bar, CD45.2 WT:CD45.1 WT, represents mice received CD45.2 WT:CD45.1 WT BM cells; red bar, CD45.2 KO:CD45.1 WT, represents mice received CD45.2 KO:CD45.1 WT BM cells. All donor mice were 6-week-old female and recipient mice were 2-month-old CD45.1+ WT female. Ratio of CD45.2+ over CD45.1+ of BM LSK cells and HSCs (C) and total white blood (CD45+) cells (D) 10-month after transplantation. (E) Number of total HSCs, CD45.2+ HSCs and CD45.1± HSCs in recipient chimera mice. WT:WT, CD45.2 WT:CD45.1 WT; KO:WT, CD45.2 KO:CD45.1 WT. n = 8 for each group. (F)–(K) A repeat of the above experiment with age-and-sex-matched 4-month-old WT and miR-146a KO female mice. (F) Representative FACS plots of BM mixtures before transplantation showing CD45.2/CD45.1 ratio close to 1 for both WT:WT and KO:WT BM mixtures. (G) Ratio of CD45.2+ over CD45.1+ cells of various lineages before transplantation. (H) Percentage of CD45.2+ cells of CD45+ peripheral blood nucleated cells at 1, 2, 3 and 6 months. (I) Ratio of CD45.2+ over CD45.1+ cells of various lineages in PB, SP, and BM 6 months after transplantation. All ratios of CD45.2 WT:CD45.1 WT are normalized to 1. Number of total, CD45.2+ and CD45.1+ LSK cells (J) and HSCs (K) in recipient chimera mice. LSK, Lin-cKit+Sca1+; HSC, LSK CD150+CD48−; L−S−K+, Lin−Sca1−cKit+.


