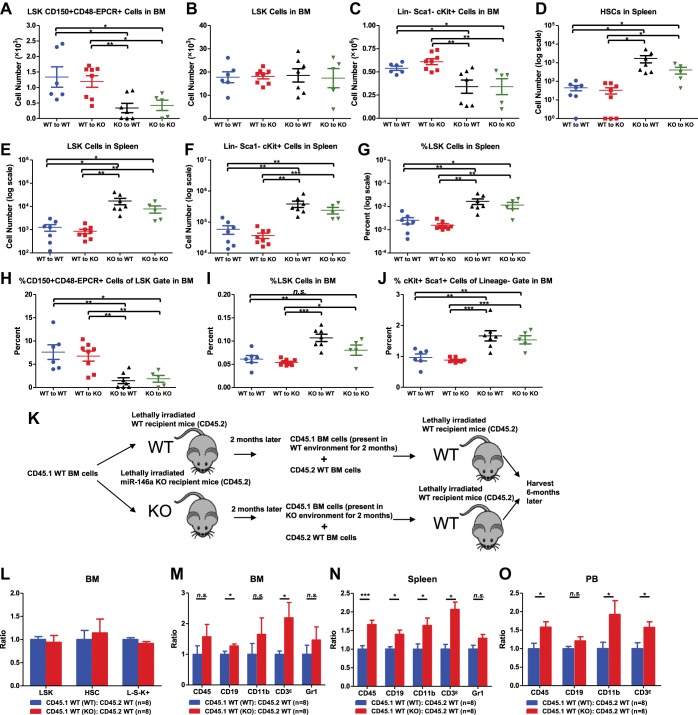
Figure 3. Hematopoietic-intrinsic and hematopoietic-extrinsic contribution to hematopoietic defects.
(A)–(J) Reciprocal bone marrow (BM) transplant performed by transferring WT donor BM cells to WT recipient mice (WT to WT), WT donor BM cells to miR-146a KO recipient mice (WT to KO), miR-146a KO donor BM cells to WT recipient mice (KO to WT), and miR-146a KO donor BM cells to miR-146a KO recipient mice (KO to KO). All donor and recipient mice were 8-week-old female mice. Mice were harvested for analysis at the end of 5 months. Quantification of total number of HSPCs in spleen and BM, including LSK CD150+CD48−EPCR+ HSCs (A), LSK (Lin−cKit+Sca1+) cells (B), Lin−cKit+Sca1− cells (C) in BM, and LSK CD150+CD48− HSCs (D), LSK cells (E), and Lin−cKit+Sca1− cells (F) in spleen. Quantification of percent of HSPCs in spleen and BM, including percent LSK cells in spleen (G), percent of CD150+CD48−EPCR+ HSCs in LSK gate in BM (H), percent of LSK cells in total BM (I), and percent of cKit+Sca1+ in Lin− gate in BM (J). (K)–(O). Serial BM transplant performed by first transplanting CD45.1+ WT BM cells into either CD45.2+ WT or miR-146a KO recipient mice for 2 months, which were then harvested and mixed with CD45.2+ WT BM cells for second transplantation into CD45.2+ WT recipient mice. Mice received CD45.1 WT (WT):CD45.2 WT or CD45.1 WT (KO):CD45.2 WT cells were harvested 6 months later for FACS analysis. (K) Schematic diagram of the experimental setup. (L) Ratio of CD45.1+ over CD45.2+ cells of BM HSPCs, including LSK cells, LSK CD150+CD48− HSCs and L−K+S− cells. Ratio of CD45.1+ over CD45.2+ cells of various lineages in BM (M), spleen (N), and PB (O), including CD45+, CD19+, CD11b+, CD3ε+ and Gr1+ cells.


