. 2013 May 21;2:e00537. doi: 10.7554/eLife.00537

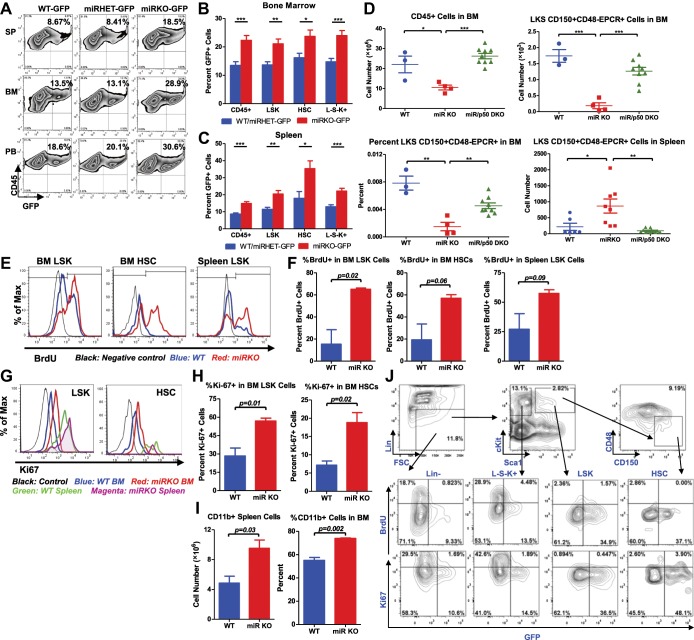
Figure 5. NF-κB regulates HSC homeostasis during chronic inflammation.

(A)–(C) 8-Week-old WT (WT-GFP), Mir146a+/ (miRHET-GFP), and Mir146a/ (miRKO-GFP) NF-κB-GFP reporter mice were subjected to repeated intraperitoneal LPS stimulation (3 mg LPS/kg of body weight every other day) for 1 week. Percent of GFP+ cells in various lineages were quantified by FACS. (A) Representative FACS plots of GFP+ white blood cells (CD45+) in spleen (SP), bone marrow (BM), and peripheral blood (PB). Quantification of percent GFP+ cells of HSPCs in bone marrow (B) and spleen (C), including CD45+, LSK cells, HSCs (LSK CD150+CD48) and LSK+ myeloid progenitor cells. (D) Age- and sex-matched WT, miR-146a KO (miR KO), and miR-146a/p50 double knockout (miR/p50 DKO) mice were allowed to age to 8–9 months before harvested for analysis. Quantification of total number of CD45+, LSK CD150+CD48EPCR+ HSCs in BM, percent of LSK CD150+CD48EPCR+ HSCs of total BM, and total number of LSK CD150+CD48EPCR+ HSCs in spleen by FACS. (E)–(I) 8-Week-old WT and miR-146a KO (miR KO) mice were subjected to repeated low-dose of intraperitoneal LPS stimulation (1 mg LPS/kg of body weight) daily for 3 days. 1 mg of BrdU was injected intraperitoneally daily. BrdU+ and Ki-67+ HSPCs were quantified by FACS. (E) Representative FACS histograms of BrdU+ LSK cells and HSCs in BM and BrdU+ LSK cells in spleen. Blue: WT mice; red: miR KO mice. (F) Quantification of percent of BrdU+ cells in BM LSK cells, HSCs, and spleen LSK cells. (G) Representative FACS histograms of Ki-67+ LSK and HSCs in BM and spleen. Black: negative control; blue: WT BM; red: miR KO BM; green: WT spleen; magenta: miR KO spleen. (H) Quantification of Ki-67+ cells in BM LSK cells and HSCs. (I) Quantification of number and percent of CD11b+ myeloid cells in spleen and BM. (J) Representative FACS plots of BrdU+ or Ki-67+ and GFP+ cells of Lin, LSK+, LSK and HSC in BM of 8-week-old WT-GFP mice stimulated with LPS (one dose, 1 mg/kg of body weight) for 4 hr.

DOI: http://dx.doi.org/10.7554/eLife.00537.010

Figure 5.

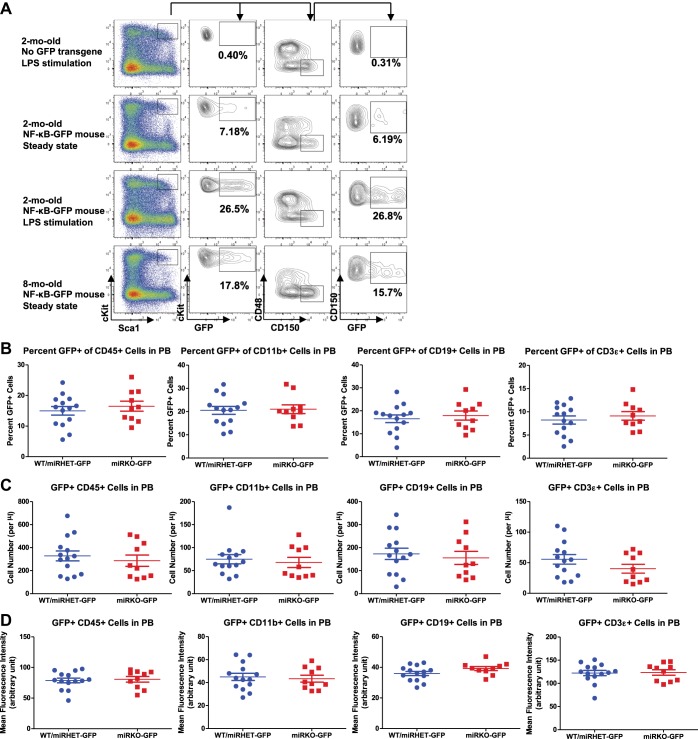
Figure 5—figure supplement 1. NF-κB activity in HSPCs and peripheral blood of NF-κB-GFP reporter mice.

Figure 5—figure supplement 1.

(A) Regular WT mice and WT NF-κB-GFP reporter mice were challenged with one dose of LPS intraperitoneally (2 mg LPS/kg body weight). GFP+ cells in various lineages were quantified by FACS 6 hr after injection. Representative FACS plots of 2-month-old regular WT mouse (without NF-κB-GFP transgene) with LPS stimulation, 2-month-old WT NF-κB-GFP reporter mouse at basal state, 2-month-old WT NF-κB-GFP reporter mouse with LPS stimulation, and 8-month-old WT NF-κB-GFP reporter mouse at basal state. Percent of GFP+ cells in LSK cells and HSCs were shown. Basal level of percent (B), number (C), and mean fluorescence intensity (MFI) (D) of GFP+ cells in various lineages in peripheral blood (PB) of 2-month-old WT (WT-GFP), Mir146a+/ (miRHET-GFP), and Mir146a/ (miRKO-GFP) NF-κB-GFP reporter mice were quantified by FACS.
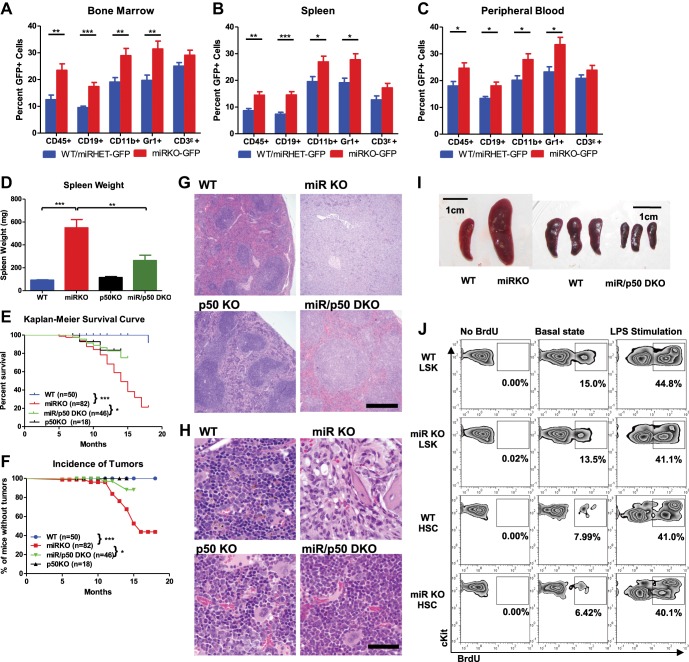
Figure 5—figure supplement 2. NF-κB regulates HSPC homeostasis during chronic inflammation.

Figure 5—figure supplement 2.

(A)–(C) Related to Figure 5A–C. 8-Week-old WT-GFP, miRHET-GFP, and miRKO-GFP reporter mice were subjected to repeated intraperitoneal LPS stimulation (3 mg LPS/kg of body weight every other day) for 1 week. Percent of GFP+ cells in various lineages were quantified by FACS. Quantification of GFP+ cells in various lineages, including CD45+, CD19+, CD11b+, Gr1+, and CD3ε+, in bone marrow (A), spleen (B), and peripheral blood (C). (D)–(H) Age- and sex-matched WT, miR KO, p50 KO, and miR/p50 DKO mice were allowed to age to up to 18 months. Mice were harvested as they became moribund or at the end of the experiment. Spleen weight (D), Kaplan–Meier survival curve (E), and incidence of tumors (F). Representative histological images (H&E staining) of spleen (G) and femur bones (H) from 12-month-old female WT, miR KO, p50 KO, and miR/p50 DKO mice. Spleen from a miR-146a KO mouse with myeloid sarcoma was shown. Scale bars, 400 μm for spleens and 40 μm for bones. (I) Representative photographs of spleens from Rag2−/− Il2rg−/− mice transplanted with WT, miR KO, or miR/p50 DKO spleen cells. Scale bar, 1 cm. (J) 8-Week-old WT and miR KO mice were challenged with one dose of LPS (2 mg LPS/kg of body weight) intraperitoneally for 12 hr. 1 mg of BrdU was injected intraperitoneally. BrdU+ HSPCs were quantified by FACS. Representative FACS plots of BrdU+ LSK cells and LSK CD150+CD48 HSCs in bone marrow of WT and miR KO mice. No BrdU, no BrdU injection; basal state, no LPS injection; LPS stimulation, BrdU, and LPS injection.